
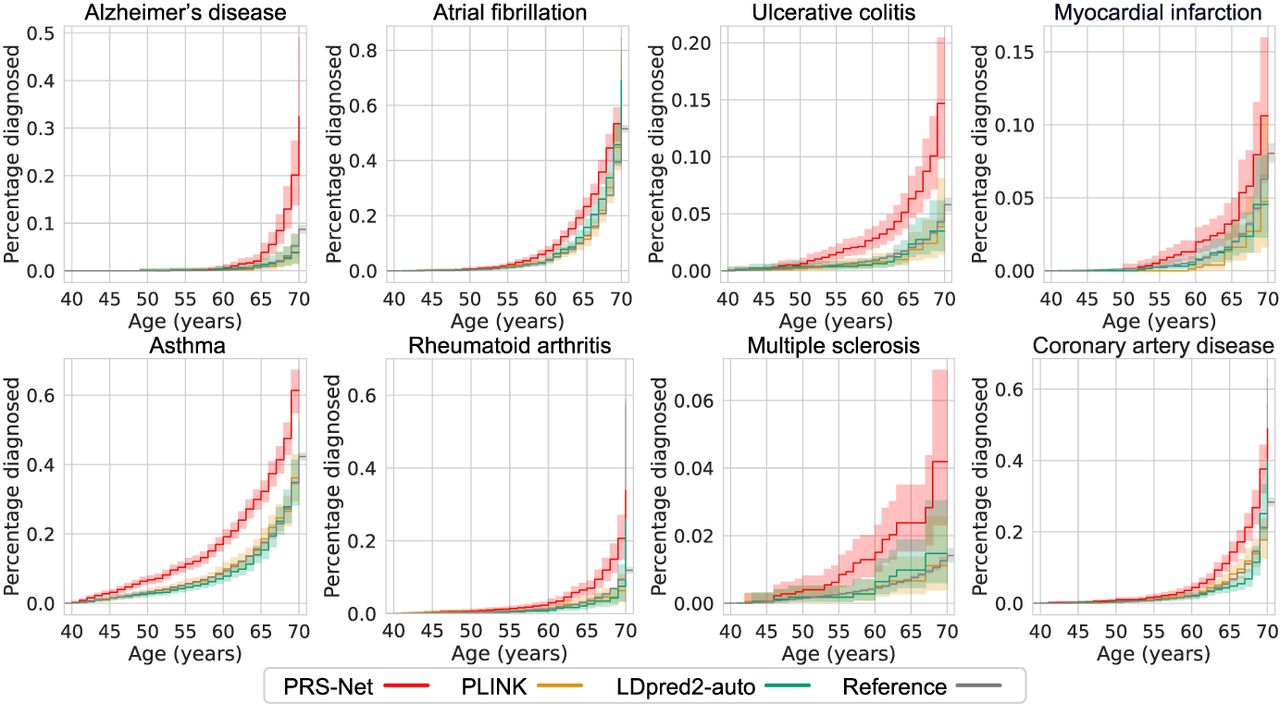
Figure 3.
The cumulative incidence plots of high-risk individuals (with the highest 5% PRSs) identified by PRS-Net and baseline methods. Each plot illustrates the estimated percentage of individuals diagnosed with a specific disease at different ages. We provide cumulative incidence plots for the original data sets as references. The shaded area denotes the standard error estimated based on six repeats.


