
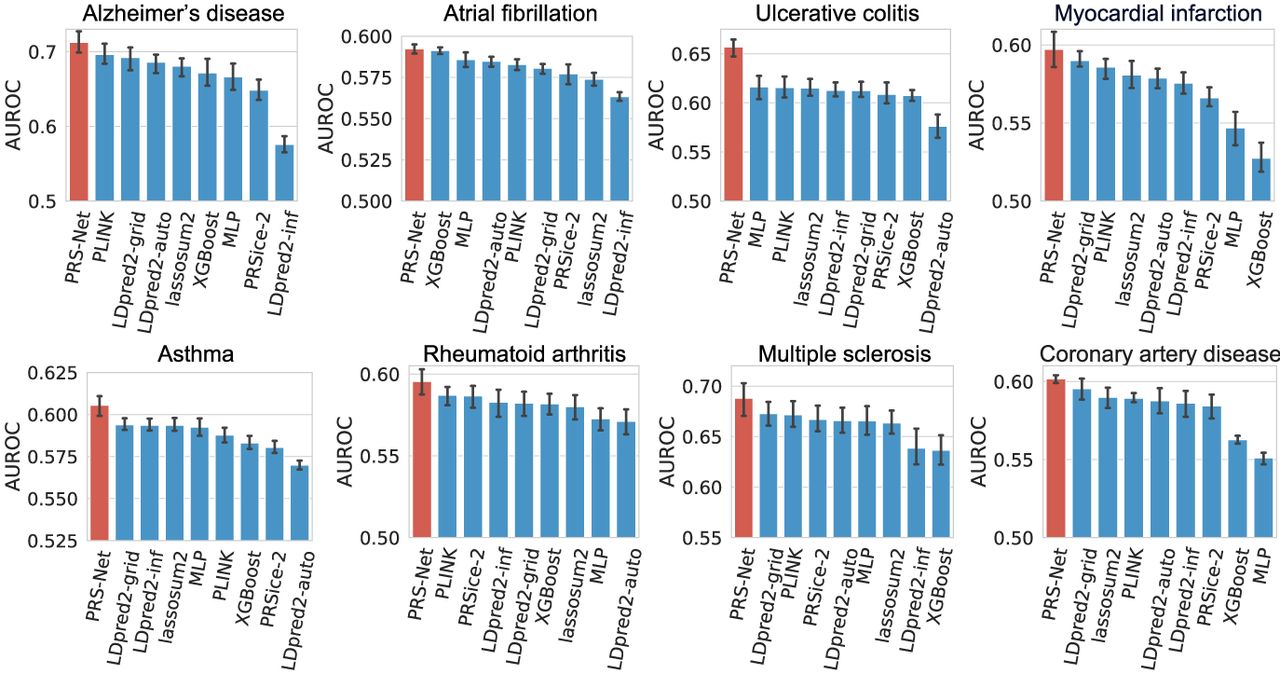
Figure 2.
Prediction performance evaluation based on the area under the receiver operating characteristic curve (AUROC) for different diseases (41,175 test samples in total). The bar plot and error bar denote the mean and standard error, respectively. The training, validation, and testing procedure was conducted for six repeats with different random seeds for each model and each disease.


