
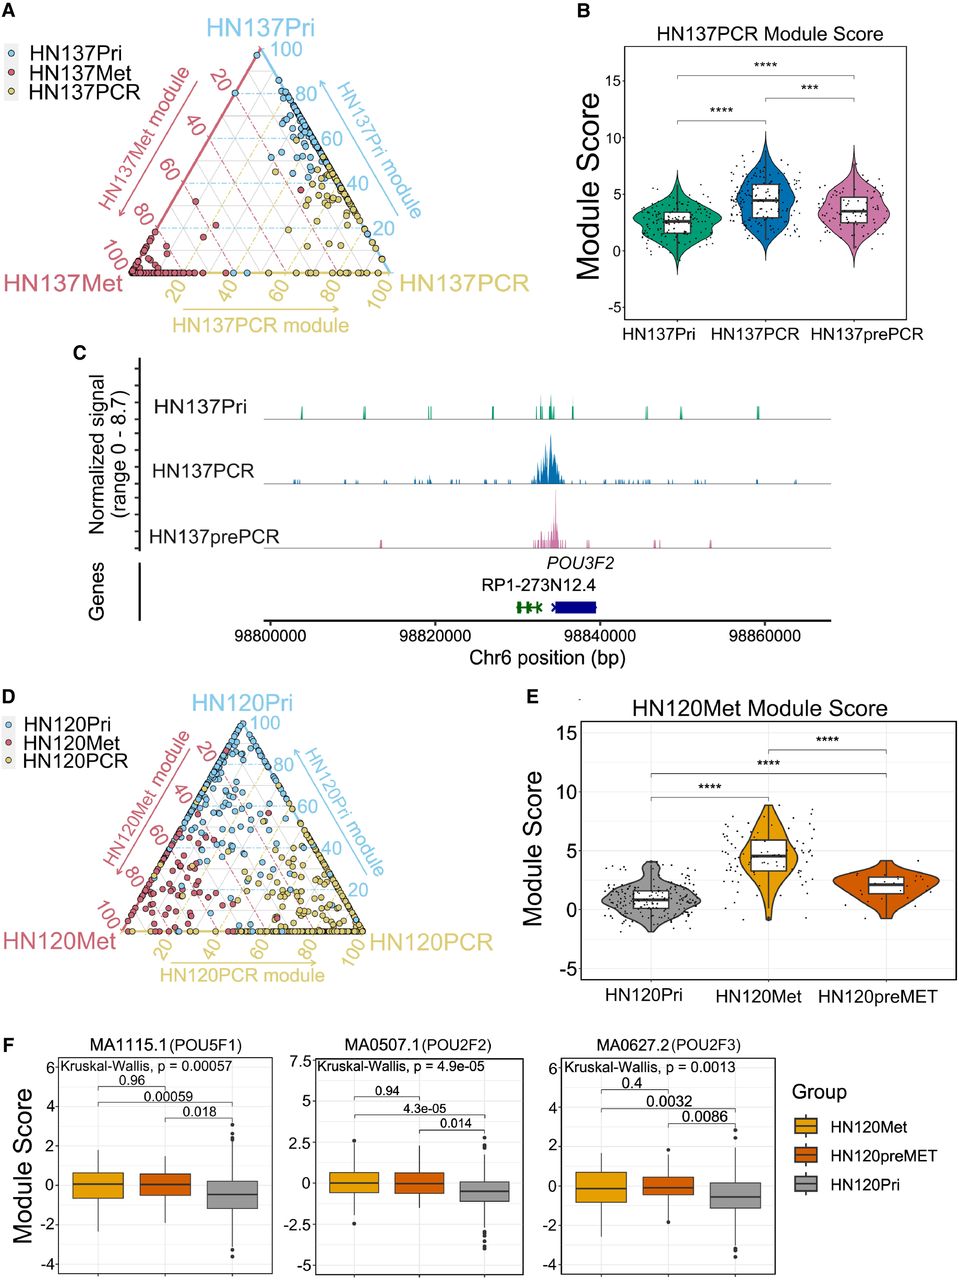
Epigenetic heterogeneity–driven HNSCC progression. (A) Ternary plot showing the ratios of Pri/Met/PCR module scores for patient HN137. (B) Violin plot depicting the recalculated HN137PCR module score after identification of the HN137prePCR subpopulation. (C) CoveragePlot of the POU3F2 locus showing higher H3K27ac localization in HN137prePCR compared with the remaining HN137Pri cells. (D) Ternary plot showing the ratios of Pri/Met/PCR module scores for patient HN120. (E) Violin plot depicting the recalculated HN120Met module score after identification of the HN120preMET subpopulation. (F) Boxplots of ChromVAR scores of several POU-domain containing proteins enriched in HN120Met, showing that the HN120preMET population has higher activity of these TFs compared with the remaining HN120Pri cells. (***) P-value ≤ 0.001, (****) P-value ≤ 0.0001.


