
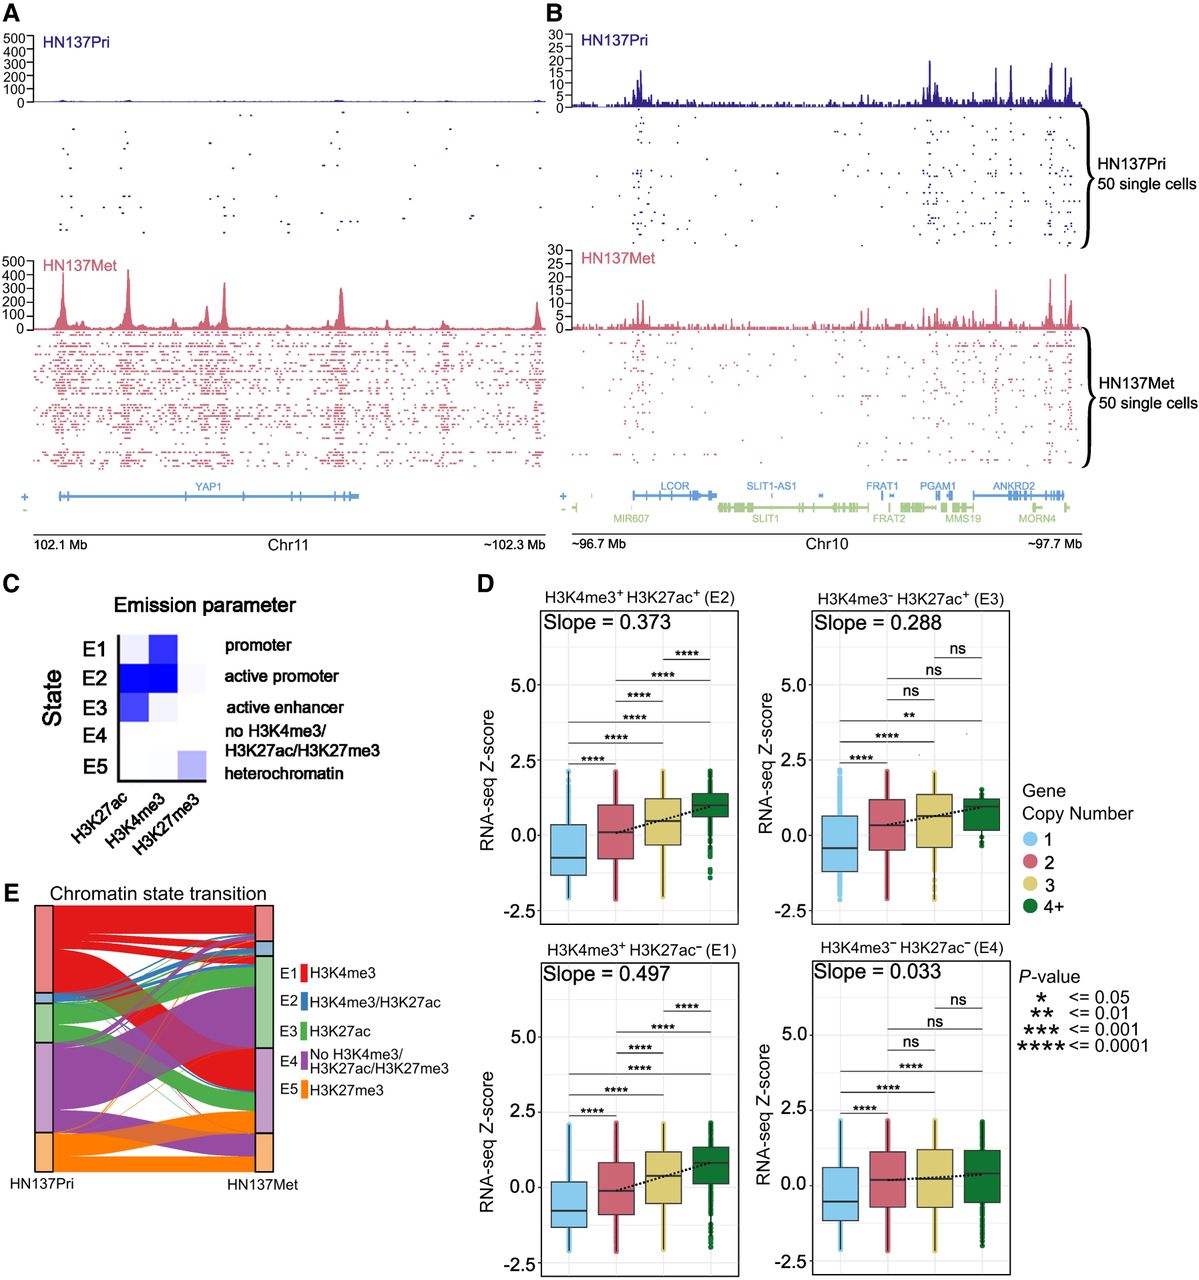
Regulation of gene expression through the interaction between copy number variations and chromatin state. (A) Distribution of unique H3K27ac reads in single cells at the YAP1 locus in HN137Pri (blue) and HN137Met (red). Bulk H3K27ac signal and H3K27ac signal in single cells are shown. (B) Distribution of unique H3K27ac reads in a random, non–copy number different locus. (C) ChromHMM results identifying five chromatin states consisting of combinations of H3K4me3, H3K27ac, and H3K27me3 modifications in HN120 and HN137 PDCs. (D) Boxplots showing HN137Met RNA-seq gene expression Z-score values, stratified by chromatin states. The genes were further grouped by copy number (CN) states: CN = 1, heterozygous deletion; CN = 2, normal diploid; CN = 3, low copy number gain; and CN = 4+, copy number amplification. Dashed lines represent quantile regression results of RNA-seq Z-scores in between groups with CN = 2, CN = 3, and CN = 4+. Slope values are also indicated. (E) Alluvial plot showing chromatin state transition between HN137Pri and HN137Met. Unmodified chromatin (E4; purple), which remained unmodified during metastatic progression, was excluded from the plot for visibility purposes. (**) P-value ≤ 0.01, (***) P-value ≤ 0.001, (****) P-value ≤ 0.0001


