
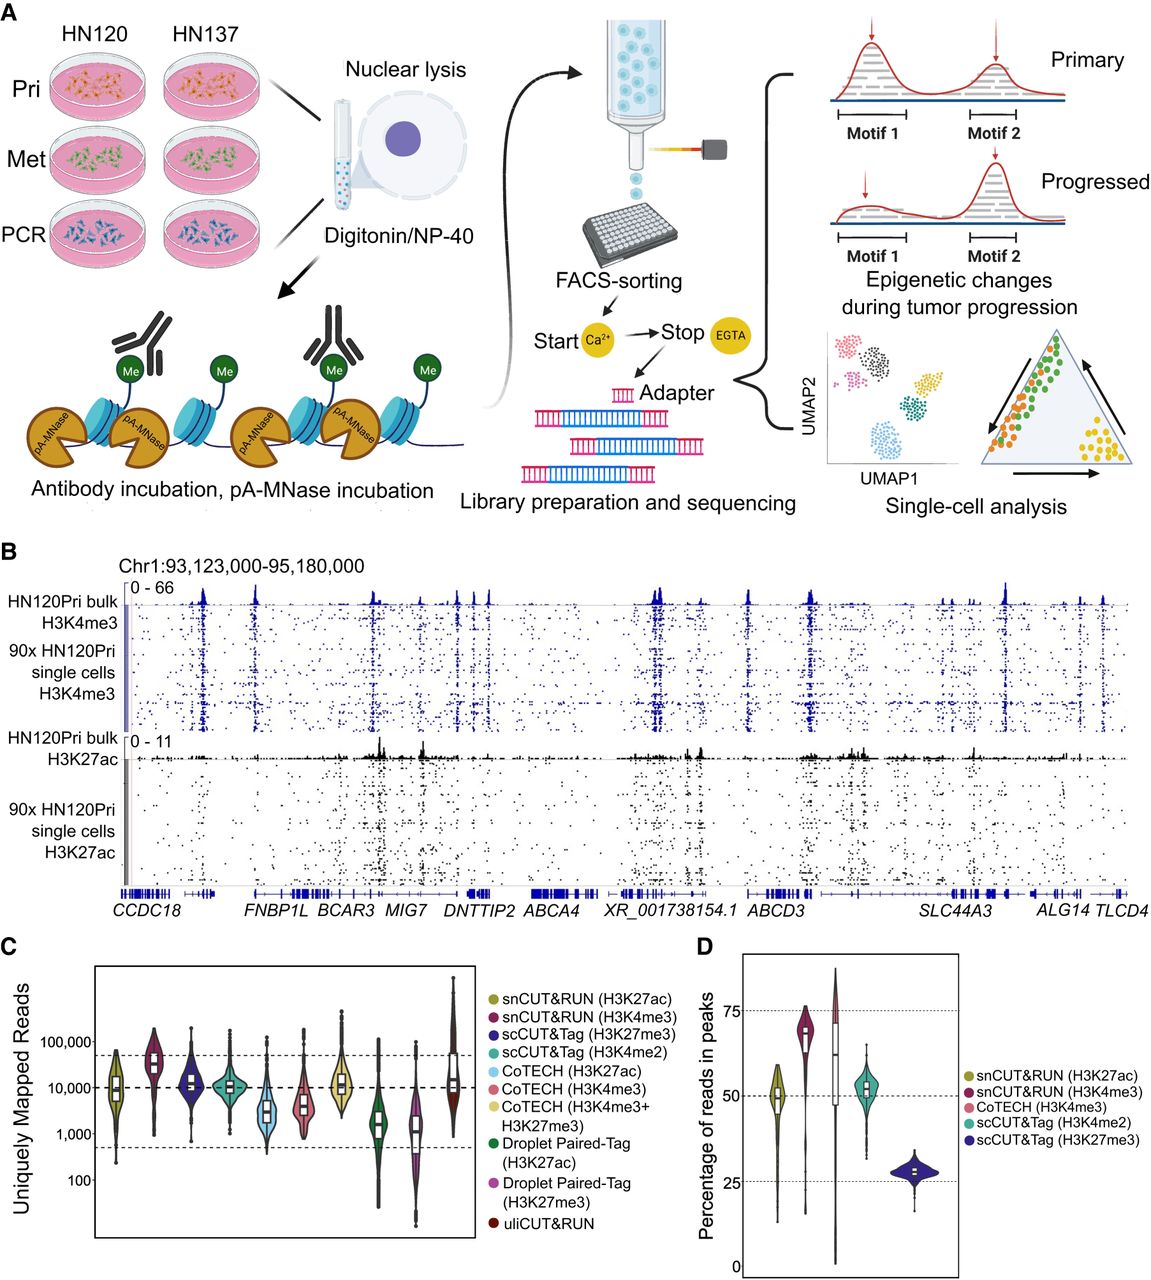
Schematic representation of overall workflow and quality control of snCUT&RUN. (A) Schematic overview of snCUT&RUN, applied on matched primary, metastatic, and primary cisplatin-resistant patient-derived head and neck cancer cell lines from two patients (HN120 and HN137). Image created with bioRender (https://www.biorender.com/) under publication license HI248I94WF. (B) Representative IGV-track image showing H3K4me3 and H3K27ac single-cell profiles of 90 HN120Pri cells, with corresponding bulk cell data for each mark (Robinson et al. 2011). (C) Violin- and boxplots showing the distribution of the number of unique mapped reads (UMRs) for each single-cell, for both H3K4me3 (median = 32,666) and H3K27ac (median = 8766). Dotted lines are at 50,000, 10,000, and 500 UMRs. snCUT&RUN data were benchmarked against uliCUT&RUN (Hainer et al. 2019), scCUT&Tag (Kaya-Okur et al. 2019), CoTECH (Xiong et al. 2021), and Droplet Paired-Tag (Xie et al. 2023). (D) Violin- and boxplots illustrating the percentage of reads in peaks for each single cell. H3K4me3 median = 68%, H3K27ac median = 49%. Dotted lines are at 75%, 50%, and 25%. snCUT&RUN was compared with CoTECH and scCUT&Tag.


