
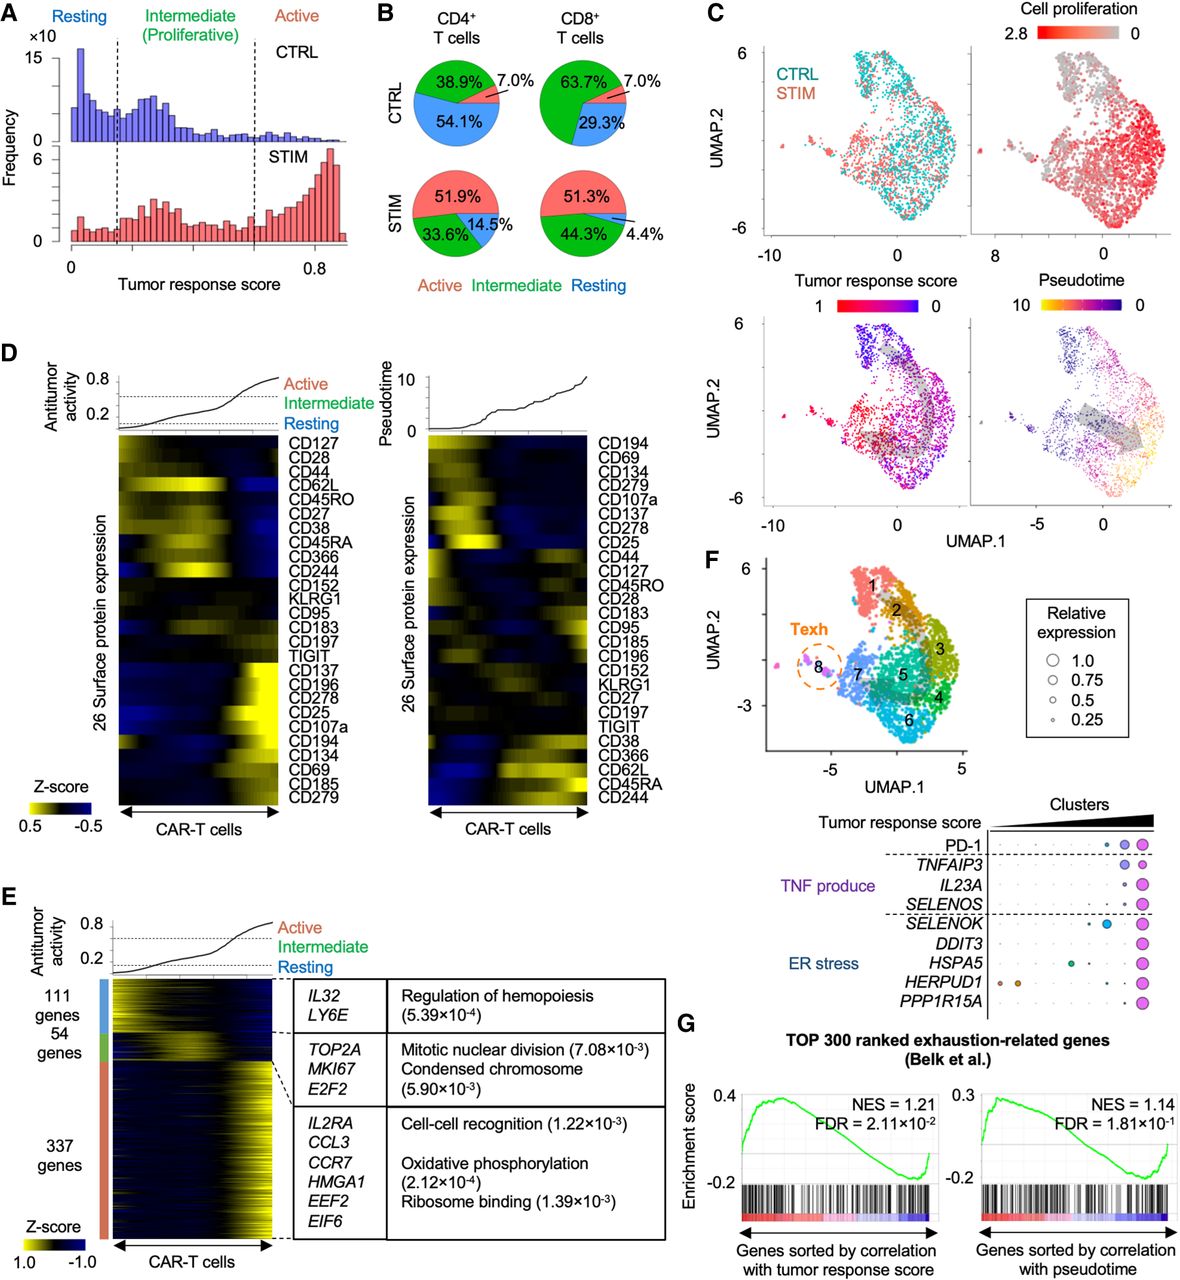
Inference of activation of CAR-T cells by neuroblastoma. (A) Histograms showing inferred antitumor activity in neuroblastoma (STIM) and nonstimulated (CTRL) CAR-T cells. (B) Pie chart of the ratio of three groups in CD4+ and CD8+ T cells with and without neuroblastoma stimulation. (C) UMAP plots of individual CAR-T cells colored by the stimulation conditions (top left), cell proliferation–related gene expression (top right), the inferred antitumor activity (bottom left), and pseudotime (bottom right). (D) Heatmap showing 26 surface protein expression dynamics across CAR-T cells. CAR-T cells were sorted by the inferred antitumor score (left) or pseudotime (right). Heatmap color represents z-score-normalized protein expression. (E) Heatmap showing differentially expressed genes across three groups. CAR-T cells were sorted by the inferred antitumor score. Representative genes and significant GO terms were shown in right panel. (F) UMAP plots of individual CAR-T cells colored by clusters (top). Representative differentially expressed surface proteins and genes are shown (bottom). The cluster number is ordered along the inferred tumor response score. (G) Gene Set Enrichment Analysis of T cell exhaustion gene signatures. Genes are sorted by Pearson correlation coefficient between their expression and antitumor score (left) or pseudotime (right). Normalized enrichment score (NES) and FDR are also shown.


