
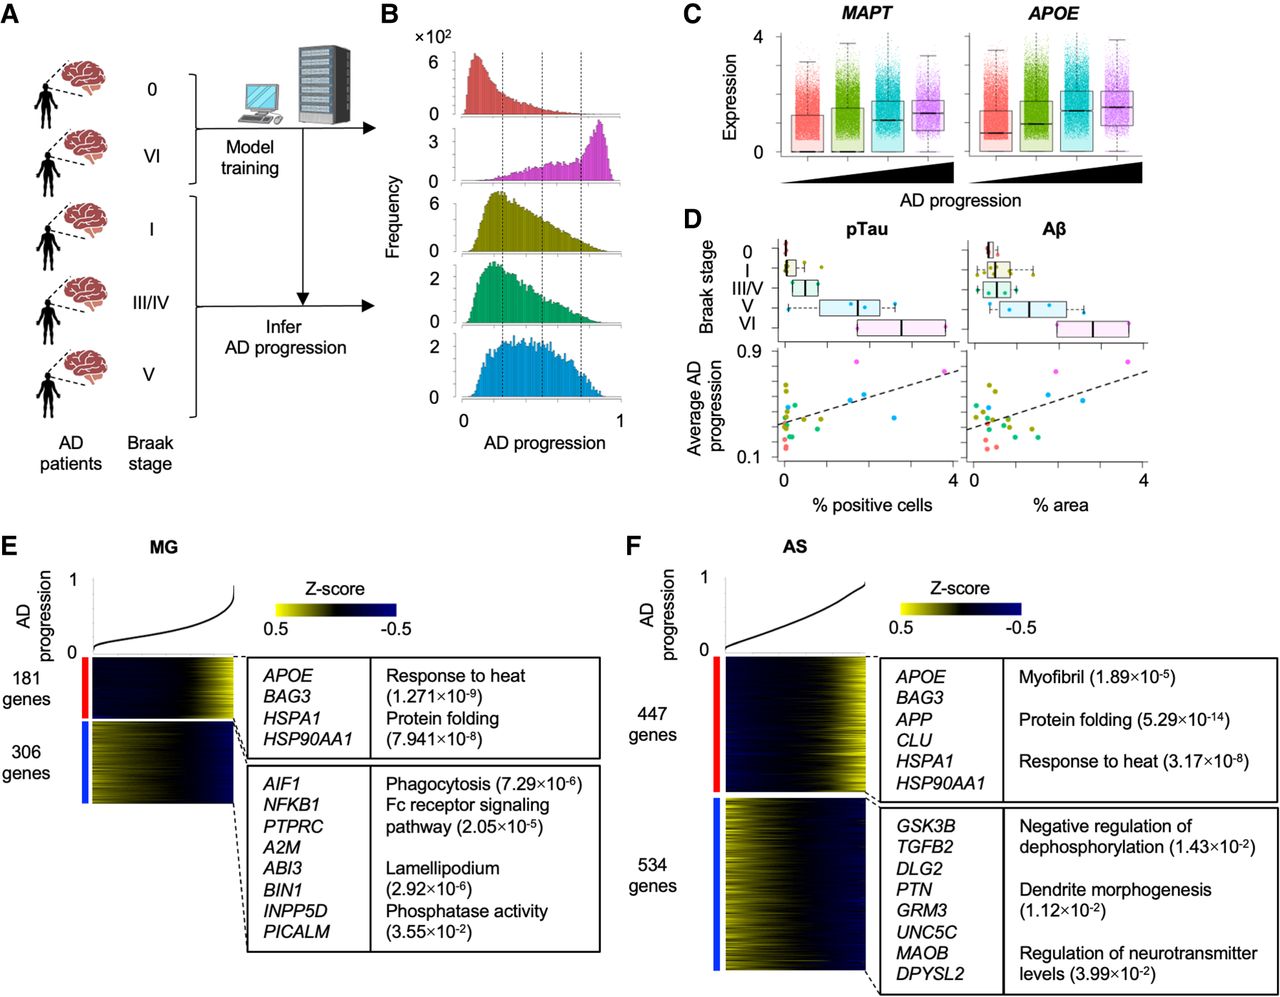
Inference of Alzheimer's disease (AD) progression across different Braak stages. (A) Strategy to estimate AD progressive levels in scRNA-seq of patient-derived samples in different Braak stages. The model was trained by Braak stages VI and 0 and estimated disease progression levels in other Braak stages. (B) Histograms of AD progressive levels in each Braak stage. Dashed lines are cutoff values to separate cells into four groups. (C) Differential expression of MAPT and APOE across four disease progression groups. (D) Comparison of average AD disease progressive levels in each patient and percentages of the pathological aggregates in the brain section. The pathological aggregate levels in each Braak stage are also shown in top panel. (E,F) Heatmap showing genes whose expression is highly correlated with inferred disease progression score (genes with Pearson's correlation > 0.1) in microglia (E) and astrocytes (F). Cells are sorted by the disease progression score. Heatmap color represents z-score-normalized gene expression. Representative genes and GO terms are shown in right panel. The statistical significance of GO terms is shown by the FDR.


