
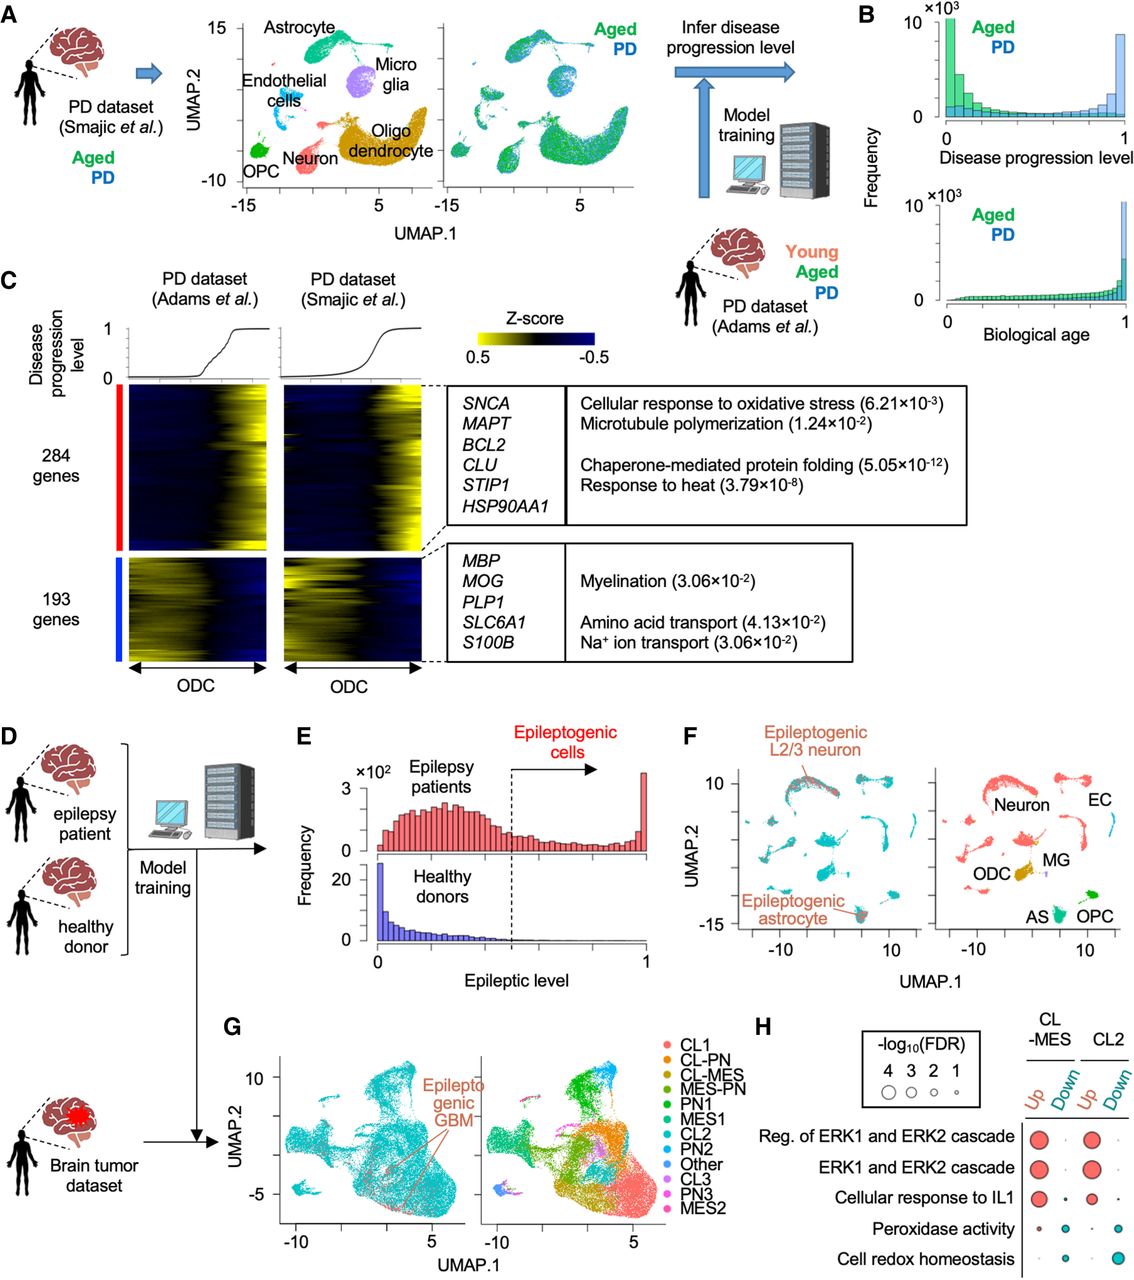
Application of pretrained weakly supervised models to other independent single-cell data sets. (A) Strategy to estimate PD progressive level by the pretrained model in another independent single-cell transcriptome data set. (B) Histogram of predicted score of disease progression level and biological age. (C) Heatmap showing genes whose expression is highly correlated with an inferred disease progression score (genes with Pearson's correlation > 0.1 in both data set A and B are used). Oligodendrocyte cells are sorted by the disease progression score. Heatmap color represents z-score-normalized gene expression. Representative genes and GO terms are shown in right panel. Statistical significance of GO terms is shown by the false-discovery rate (FDR). (D) Strategy to infer epileptogenic cells in GBM tissues using weakly supervised deep learning model. (E) Histogram showing the inferred epileptic levels of individual cells in epilepsy patients and healthy donors. Dashed line represents threshold to define epileptogenic cells. (F) UMAP plot of single cells colored by epileptogenic (red) and nonepileptogenic cells (blue; left) and cell types (right) in scRNA-seq of epilepsy patients and healthy donors. (G) UMAP plot of single cells colored by epileptogenic (red) and nonepileptogenic cells (blue; left) and clusters (right) in scRNA-seq of GBM patients. (H) Representative GO terms of differentially expressed genes between epileptogenic and nonepileptogenic cells in CL-MES and CL2 cluster. (CL) Classical, (MES) mesenchymal, and (PN) proneural.


