
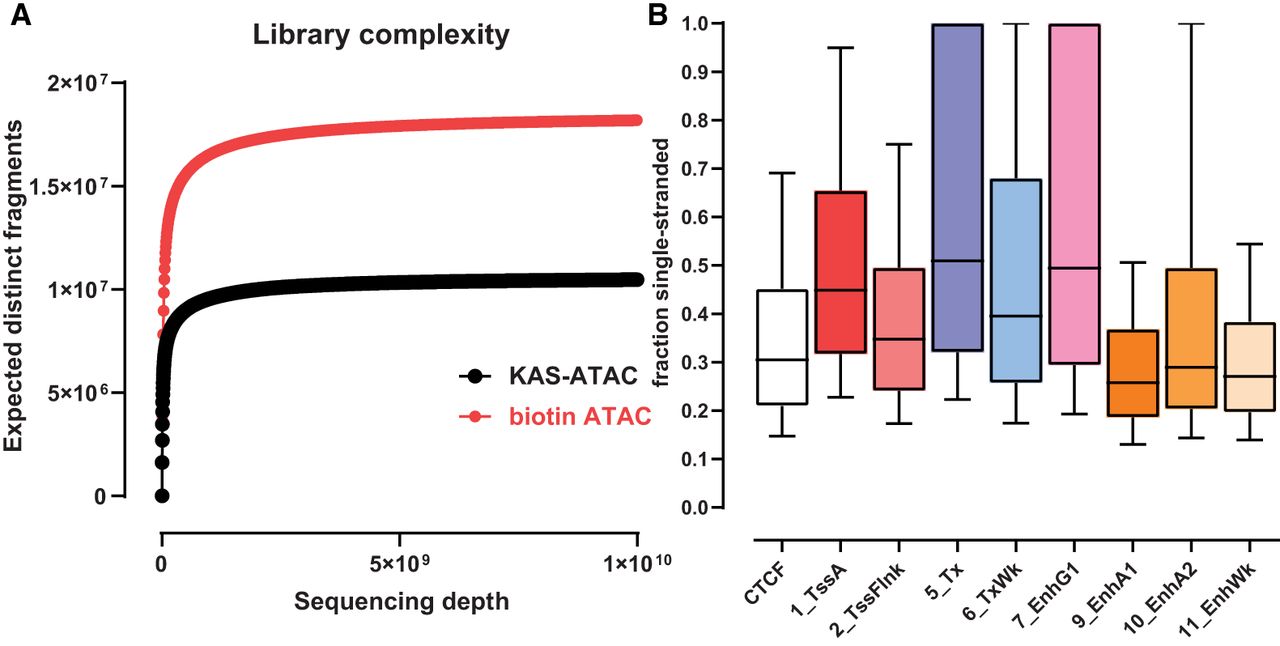
Figure 3.
Estimating absolute levels of single-stranded accessible DNA. (A) Estimates for total library complexity in KAS-ATAC and biotin-ATAC HEK293 samples. (B) Distribution of the ratios between the number of KAS-ATAC molecules and biotin-ATAC molecules for ATAC-seq peaks found in different chromatin states and for CTCF occupancy sites.


