
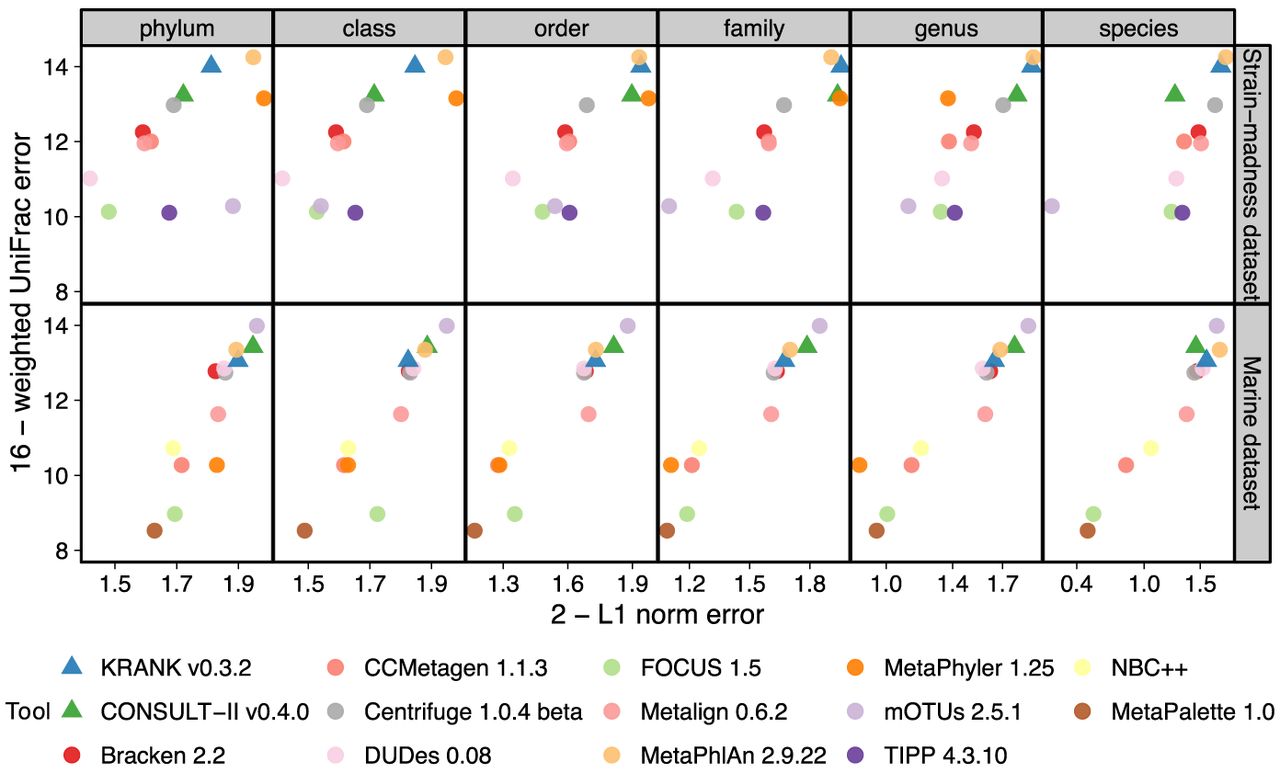
Comparing KRANK (high-sensitivity setting using 51.2 GB) with other participants in CAMI-II benchmarking challenge (Meyer et al. 2022). As in that original paper, we show the upper bound of L1 norm (2) minus actual L1 norm versus the upper bound of weighted UniFrac error (16) minus actual weighted UniFrac error. Each data point stands for the average of 100 strain-madness samples or 10 marine samples. Metrics were computed using OPAL with default settings and the -n option. The UniFrac error is the total amount of predicted abundances that needs to be moved along the edges of the taxonomic tree to make them overlap with the true abundance profile. The L1 error simply measures the accuracy of reconstructing the relative abundance profile at a fixed rank.


