
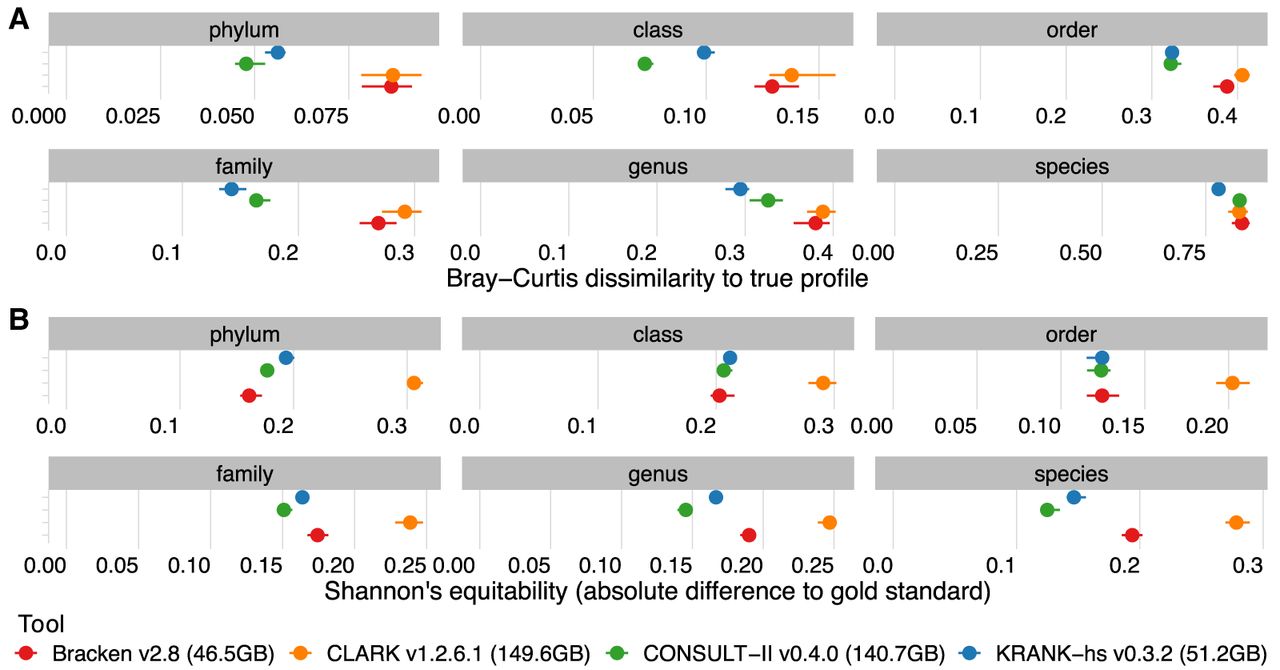
Figure 5.
Taxonomic profiling on CAMI challenge. (A) The Bray–Curtis metric measures the dissimilarity between the estimated and true profiles. (B) The difference between Shannon's equitability of the estimated profile and of the gold standard, measuring how well each tool reflects the alpha diversity (i.e., the evenness of taxon abundances). Reported metrics are based on the profile estimates of the high-sensitivity (hs) setting of KRANK. We show the mean and minimum/maximum across five samples.


