
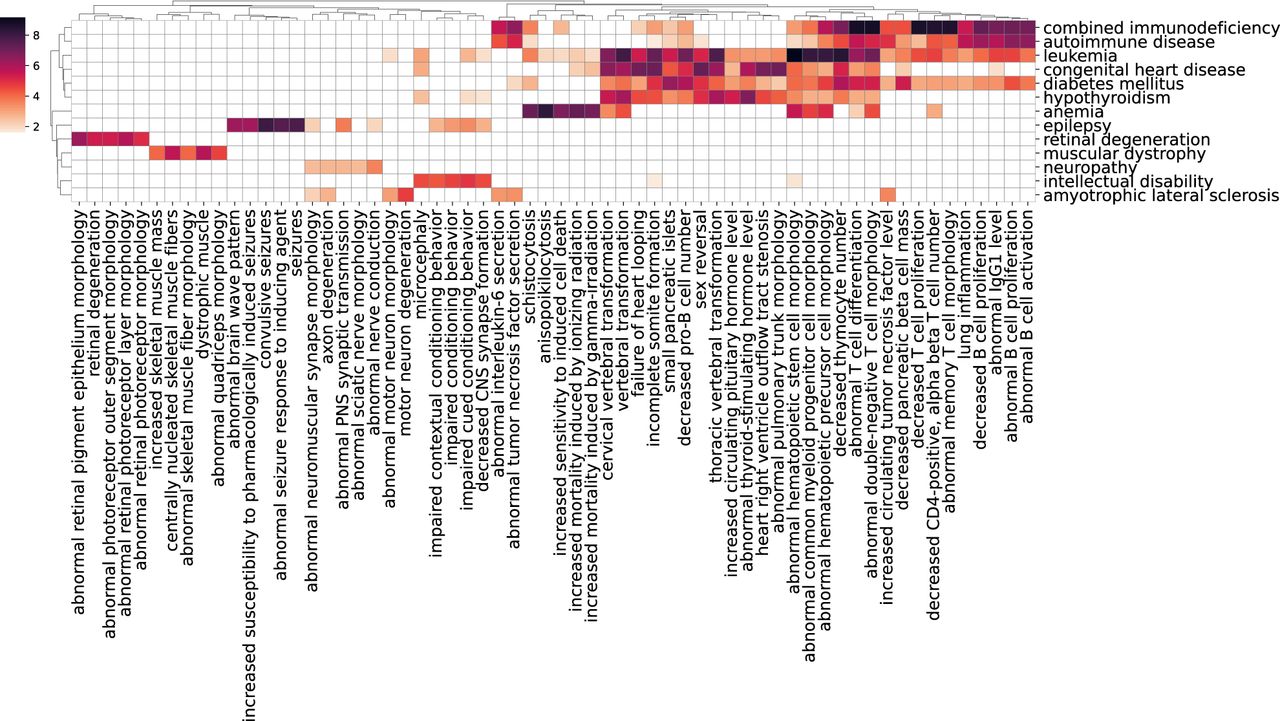
Figure 6.
Heatmap of ANDES similarity scores for human disease and mouse phenotype gene sets. Gene set similarity Z-scores generated by ANDES are shown for 13 selected human diseases across various organ systems and pathological pathways. For each human disease, the top five mouse phenotypes predicted to be functionally similar are selected (62 mouse phenotypes). The intensity of color indicates the extent to which disease-phenotype associations exceed Z-score = 1.64 (corresponding to P-value = 0.05).


