
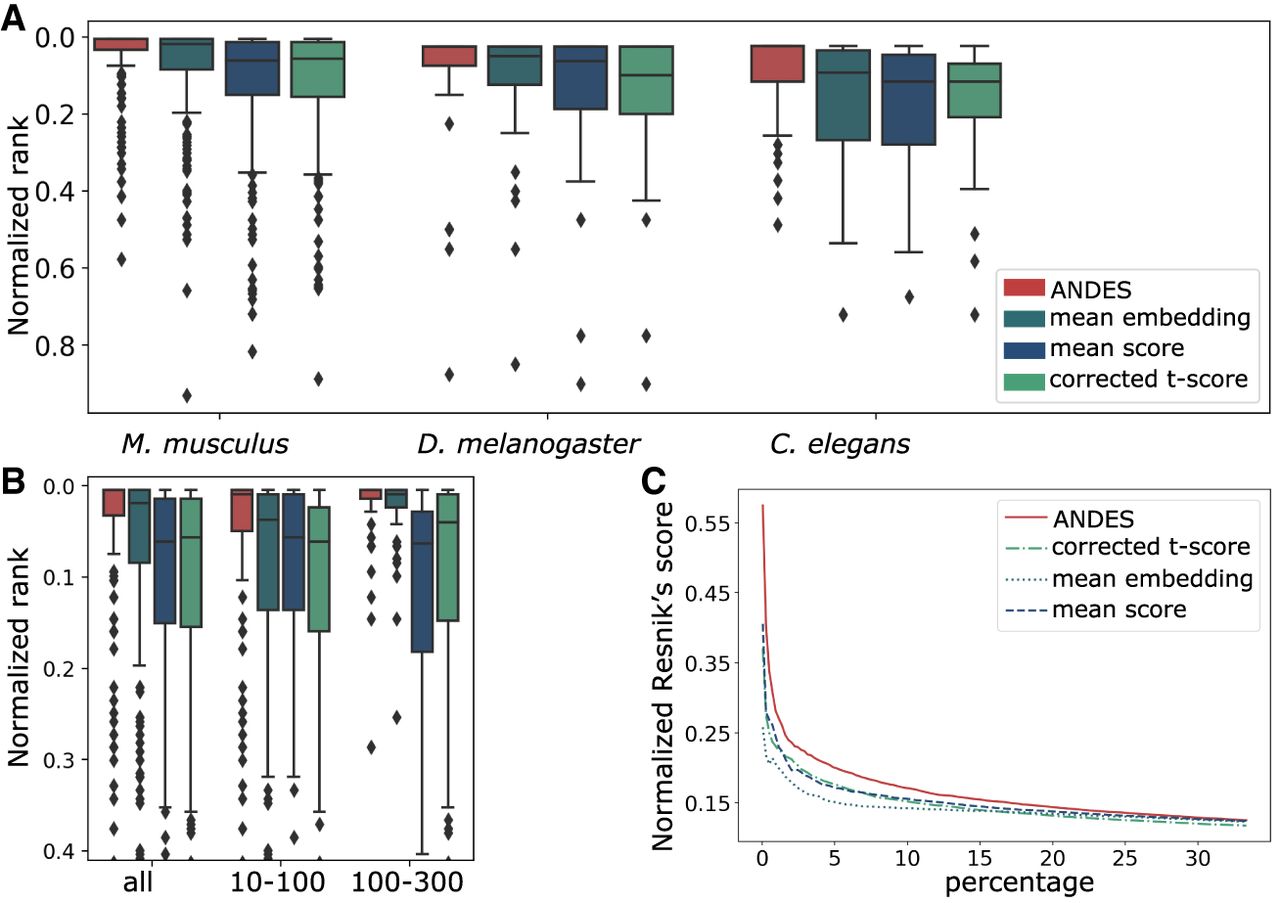
ANDES estimates gene set functional similarity across organisms better than existing methods. (A) Boxplot of the ranking of matched GO terms between human and three model organisms: M. musculus, D. melanogaster, and C. elegans, with 213, 40, and 43 shared GO slim terms, respectively. To facilitate comparison between organism pairs, the ranking is normalized by the number of shared GO terms. For each of the three organisms, ANDES consistently outperforms the mean embedding, corrected t-score, and mean score methods. (B) Boxplot of the ranking of matched GO terms for Homo sapiens and M. musculus. Gene set pairs are grouped into two categories according to the sum of the number of genes in both gene sets (small [10–100] and large [101–300]). ANDES again consistently outperforms other methods regardless of gene set size. (C) Comparison of the cumulative average of the Resnik's score walking down the ranked list for H. sapiens and M. musculus. ANDES consistently outperforms other methods until the score converges at ∼30% of all pairs.


