
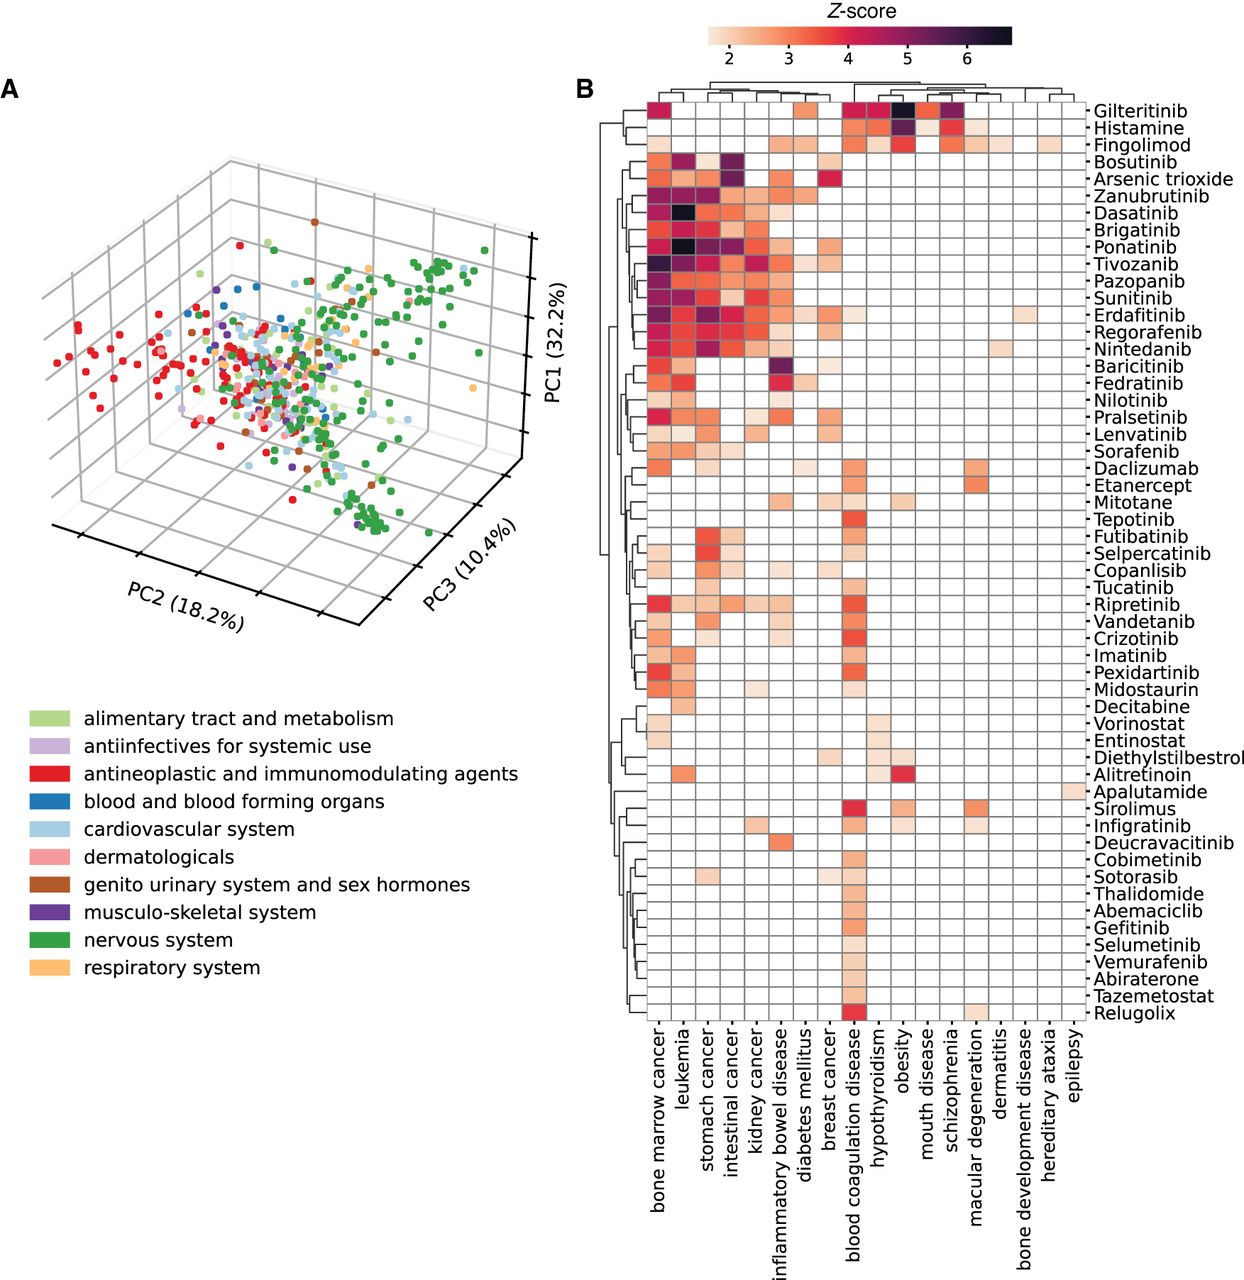
Figure 4.
Analysis of drug–disease relationships using ANDES. (A) PCA plot of the first three principal components (PCs) showing the relationship between drugs based on their association with diseases. Colors are based on the first level of ATC groups. The first three PCs explain 32.2%, 18.2%, and 10.4% of the total variance, respectively. (B) Heatmap of ANDES gene set similarity Z-scores (darker color indicates higher Z-score) between diseases and drugs in the “antineoplastic and immunomodulating agents” therapeutic class. Diseases and drugs that have at least one association (Z-score > 1.64) are retained, yielding a heatmap of 18 diseases and 54 drugs.


