
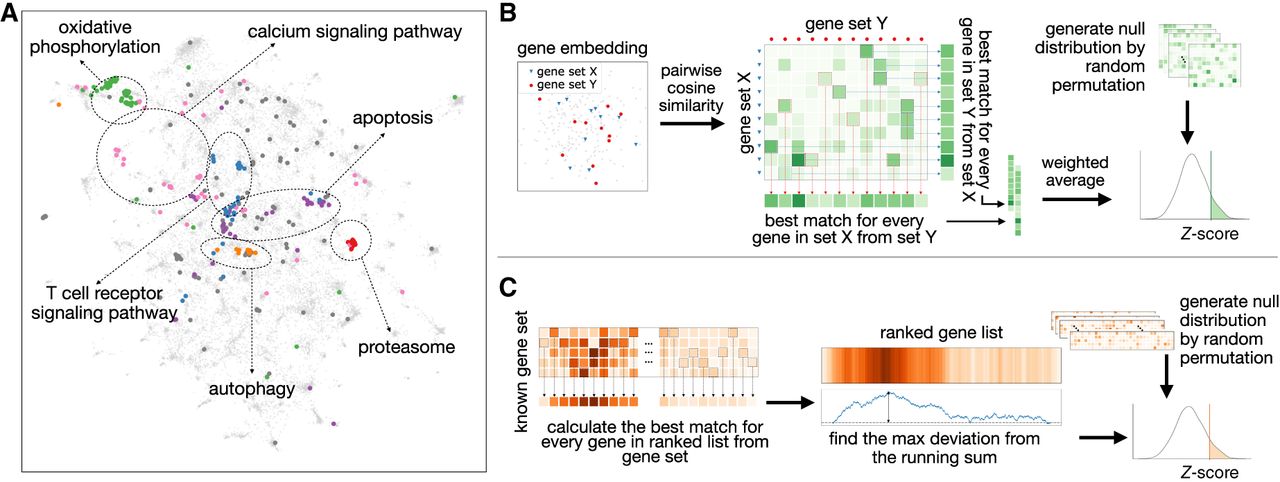
Overview of ANDES. (A) A Uniform Manifold Approximation and Projection (UMAP) plot (McInnes et al. 2018) of the node2vec gene embedding for a human protein–protein interaction network with a set of Alzheimer's disease genes (hsa05010) highlighted. Within this set of disease genes, several subclustered biological processes representing diverse biological functions are scattered across the embedding space. ANDES is capable of considering this functional diversity when matching gene sets. (B) Overview of the ANDES set similarity framework. Given two gene sets, ANDES first calculates the pairwise cosine similarity between every gene in each of the two sets. Based on the underlying similarity matrix, ANDES finds the best match for every gene (in both directions), and then calculates the weighted average (taking into account gene set size) to yield a single score. Statistical significance is estimated using a cardinality-aware null distribution. (C) Overview of the ANDES rank-based gene set enrichment method. Given a ranked gene list based on an experimental result and a known gene set, ANDES calculates the best-match similarity for every gene in the ranked list. Walking down the ranked list, ANDES finds the maximum deviation from the running sum. The final enrichment score is also estimated using a cardinality-aware null distribution.


