
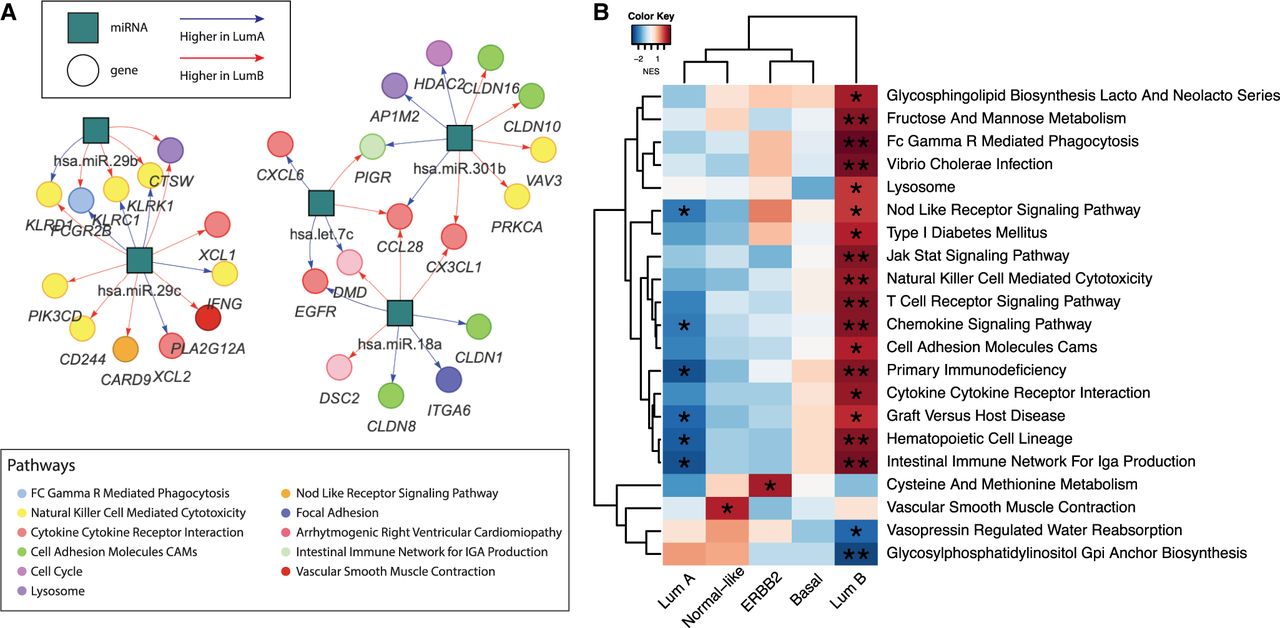
BONOBO networks reveal distinct miRNA–mRNA coexpression patterns in different breast cancer subtypes. (A) Pairs of genes and miRNAs that are most differentially coexpressed between Luminal A and Luminal B subtypes: Gene nodes are represented by colored circles, where the colors correspond to the biological pathway associated with that gene; miRNAs are represented by teal squares. Edges are colored red if they have higher weights in Luminal A compared with Luminal B and are colored blue if its miRNA-specific degree is greater in Luminal B than in Luminal A. (B) Pathways for which the mean correlation with miRNAs is significantly (at significance level 0.05) associated with survival in a Cox proportional hazard model: Heatmaps are colored by the t-statistic of the pathway score in the Cox model. Rows correspond to pathways, and columns represent the breast cancer subtypes. Pathways for which a higher correlation with miRNAs is associated with better survival are colored blue, and pathways for which a higher correlation with miRNAs is associated with worse survival are colored red.


