
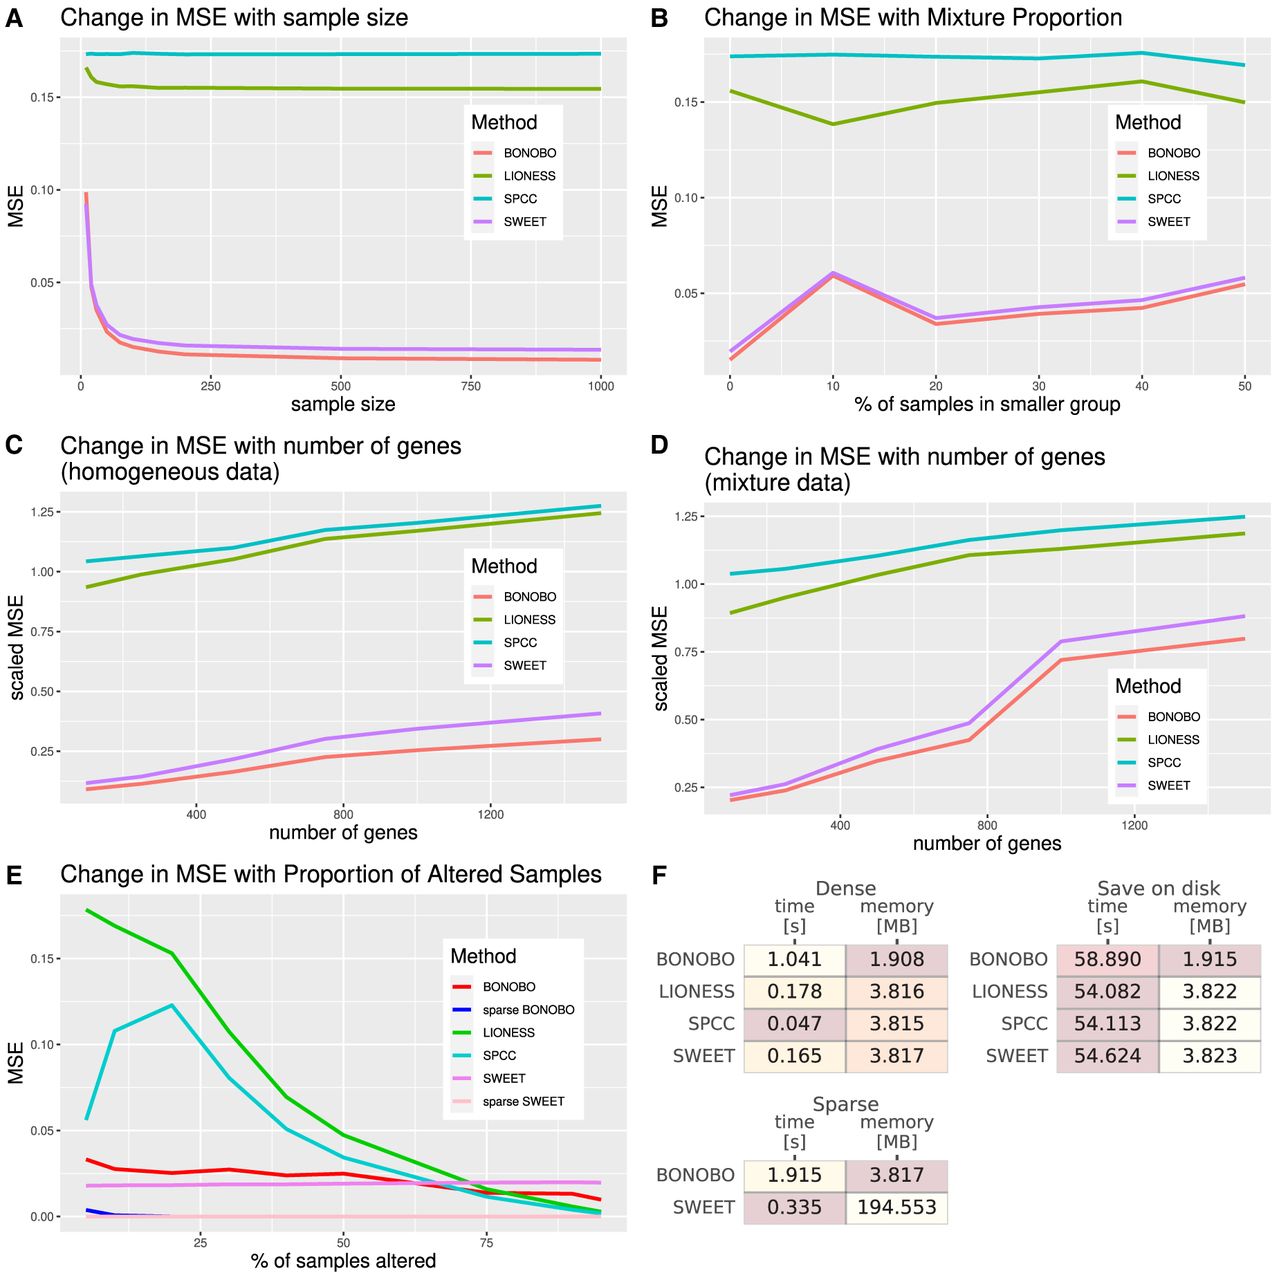
Comparisons between BONOBO and other methods for the estimation of sample-specific coexpression on simulated data. Performance of BONOBO, LIONESS::Pearson, SPCC, and SWEET on simulated data. (A) Simulated data from homogeneous population: change in MSE with respect to sample size. (B) Simulated data from a mixture of two populations: change in MSE with respect to the percentage of samples in the smaller population. (C) Simulated data from a homogeneous population: change in scaled MSE (MSE divided by the variance) with respect to the number of genes. (D) Simulated data from a mixture of two populations, in which 20% of samples come from one population and the remaining 80% of samples come from another population with distinct mean and covariance of gene expression: change in scaled MSE with respect to the number of genes. (E) Simulated data in which some samples lost expression of 1% of genes: a change in MSE with respect to the proportion of altered samples. BONOBO outperforms all three competing methods by providing lower MSE across varying sample sizes, varying mixture proportions of subpopulations, and varying the number of genes. (F) Computational resources required to run each method: We report average time and memory consumption measured over 10 data sets, with 500 genes and 100 samples; darker colors correspond to better performance/lower resources. We first compare resources to infer “dense” networks, the standard implementation of each method, and those needed to infer “sparse” BONOBO and SWEET. Then, we compare the resources required to infer and save to disk each network (save on disk), which is a more realistic scenario when dealing with larger data sets. BONOBO consistently performs better in terms of required memory, although it is slower than the others. However, we can see that when networks are saved on disk, which is a time-consuming task, BONOBO's disadvantage is greatly reduced.


