
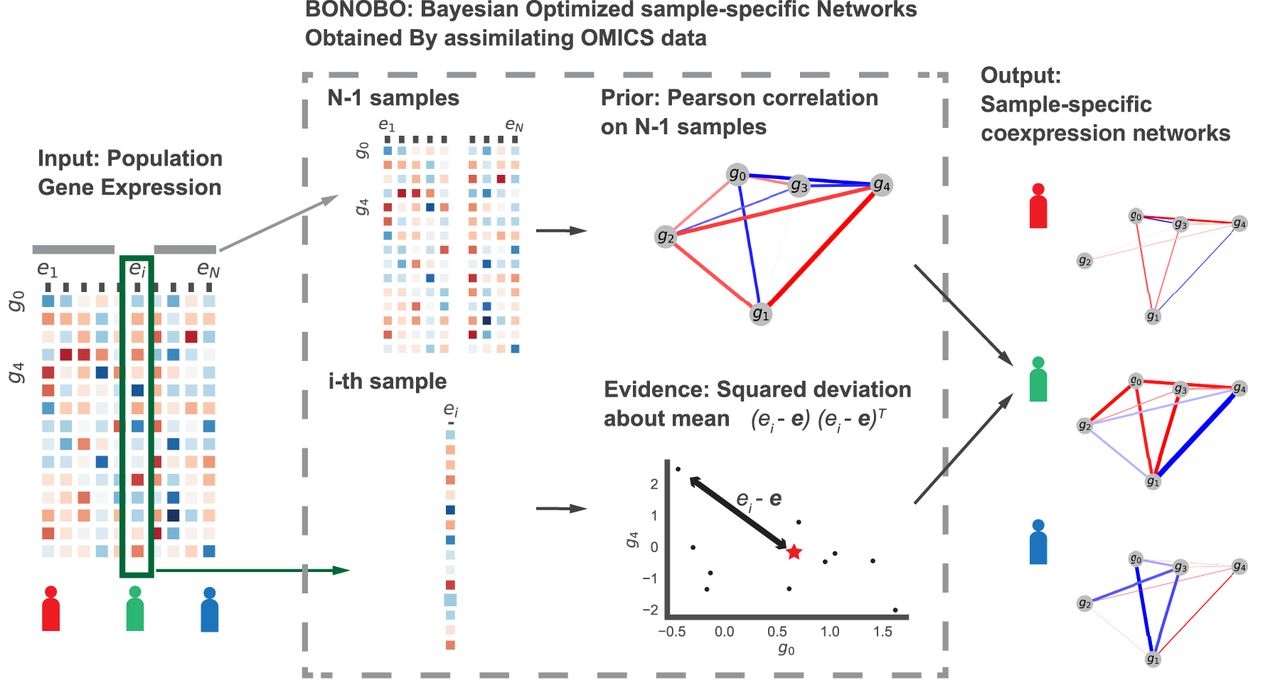
Figure 1.
Schematic diagram of BONOBO. BONOBO requires a gene expression matrix as input, from which we would like to extract sample-specific correlation networks. Then, for each of the samples, BONOBO infers the network by using both the Pearson correlation matrix computed on N − 1 samples and the sample-specific squared-deviation about the mean. BONOBO outputs N coexpression networks, one for each sample, and the associated P-values for each of the gene–gene estimated edges.


