
Figure 3.
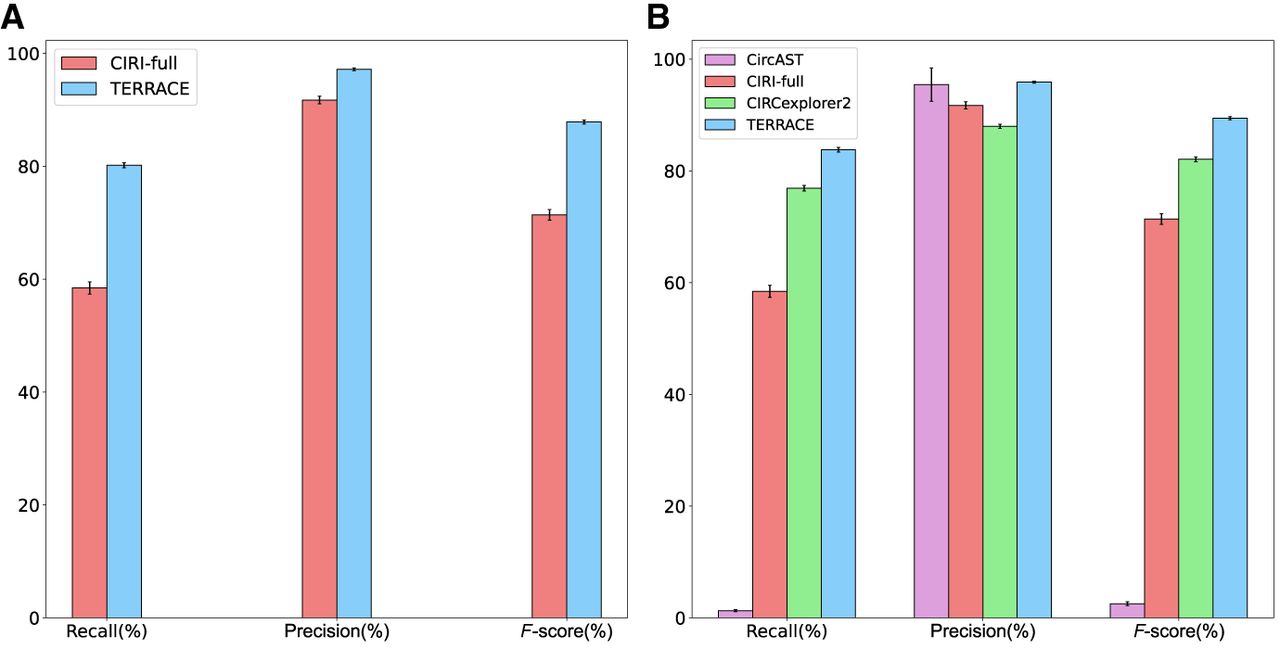
Average accuracy of different tools on simulated data, (A) without annotation and (B) with annotation. The error bars show the SD over 10 simulated samples.
(Downloading may take up to 30 seconds. If the slide opens in your browser, select File -> Save As to save it.)
Click on image to view larger version.
Average accuracy of different tools on simulated data, (A) without annotation and (B) with annotation. The error bars show the SD over 10 simulated samples.
 CiteULike
 Delicious
 Digg
Digg Facebook
 Google+
 Reddit
 Twitter
