
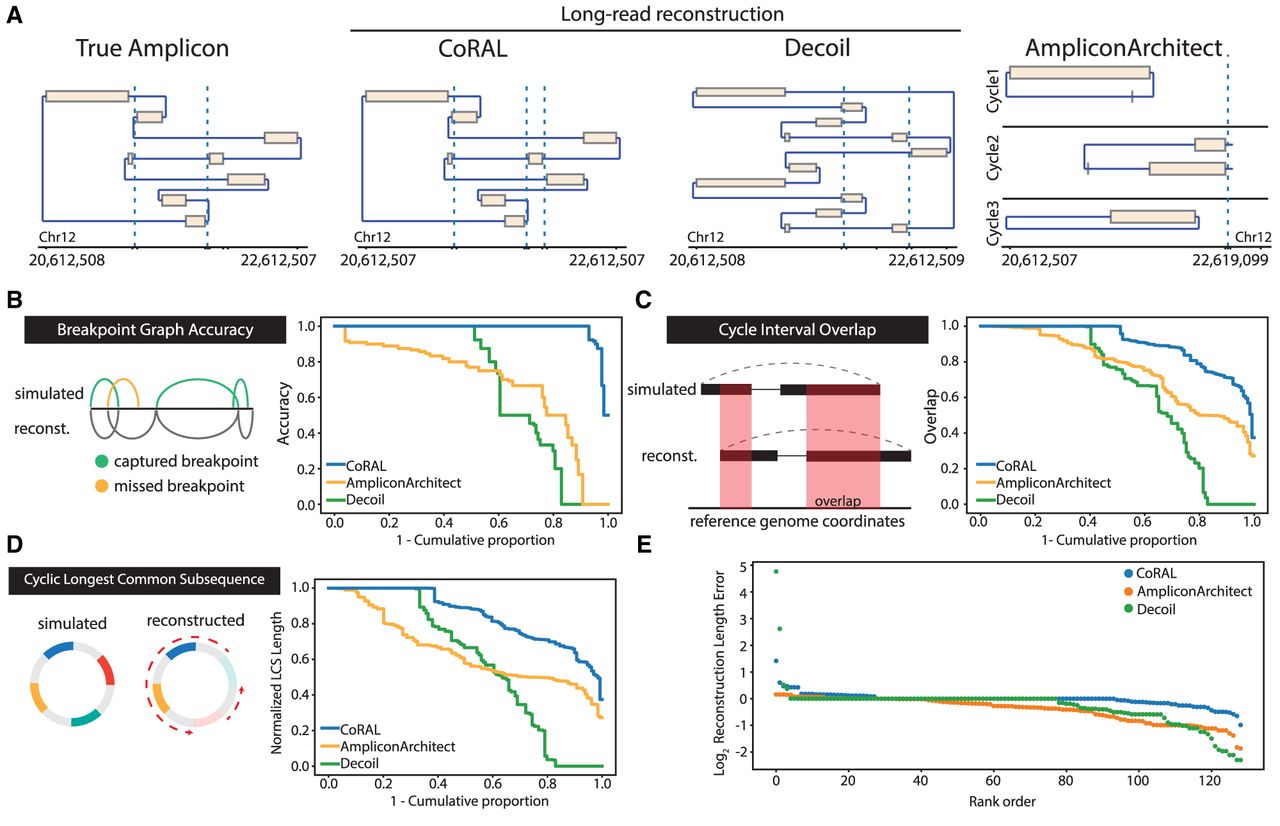
Figure 2.
Overview of simulation benchmarking. (A) True structure compared with CoRAL, Decoil, and AA reconstructions for an example amplicon (Episomal, eight observed breakpoints). (B–E) Cumulative distributions of CoRAL, Decoil, and AA reconstructions across all simulations for breakpoint graph accuracy (B), cycle interval overlap (C), cyclic longest common subsequence (D), and rank-order distribution of reconstruction length error (E). Empirical cumulative densities are reported for B, C, and D; and each point in E corresponds to a simulated amplicon. For more detailed information, see Supplemental Methods S7.


