
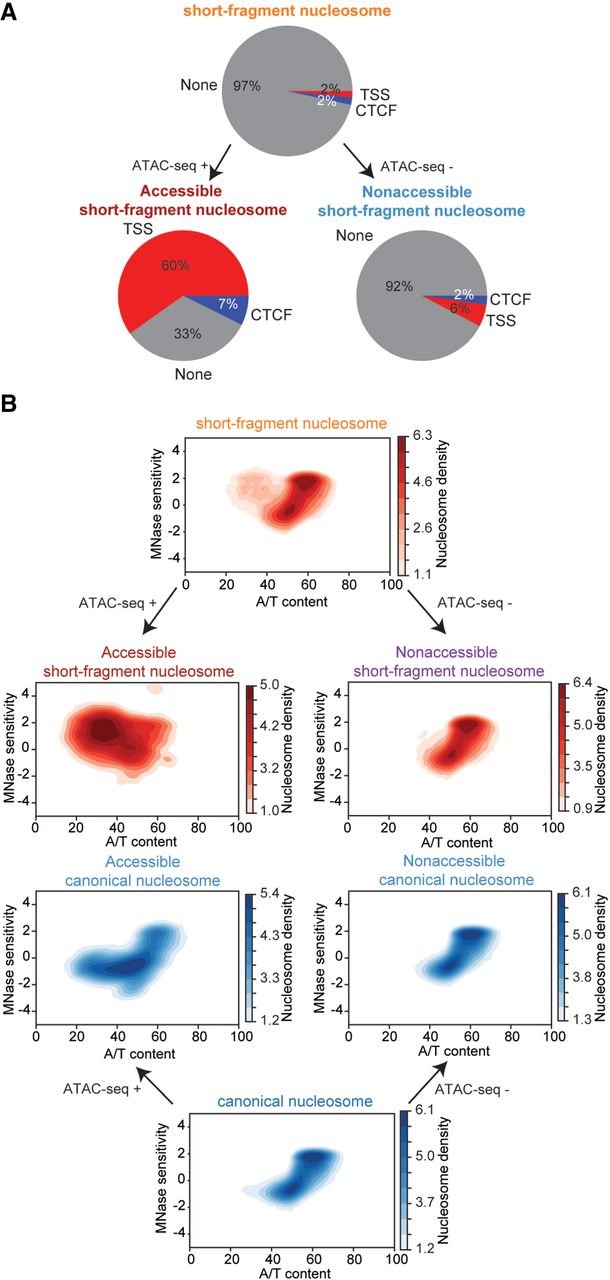
Figure 4.
Subcategorization of SEM nucleosome subtypes reveals a population of accessible short-fragment nucleosomes. (A) Percentages of short-fragment nucleosome subtype and subcategories located at TSS regions (±500 bp) and CTCF binding sites. (B) 2D density plots show the relationships between A/T content and MNase sensitivity of each nucleosome subtype and subcategory; color bars indicate the log density of nucleosomes. Nucleosome subcategories were obtained by examining if the nucleosome is fully overlapped by ATAC-seq peak (ATAC-seq +) or not (ATAC-seq –).


