
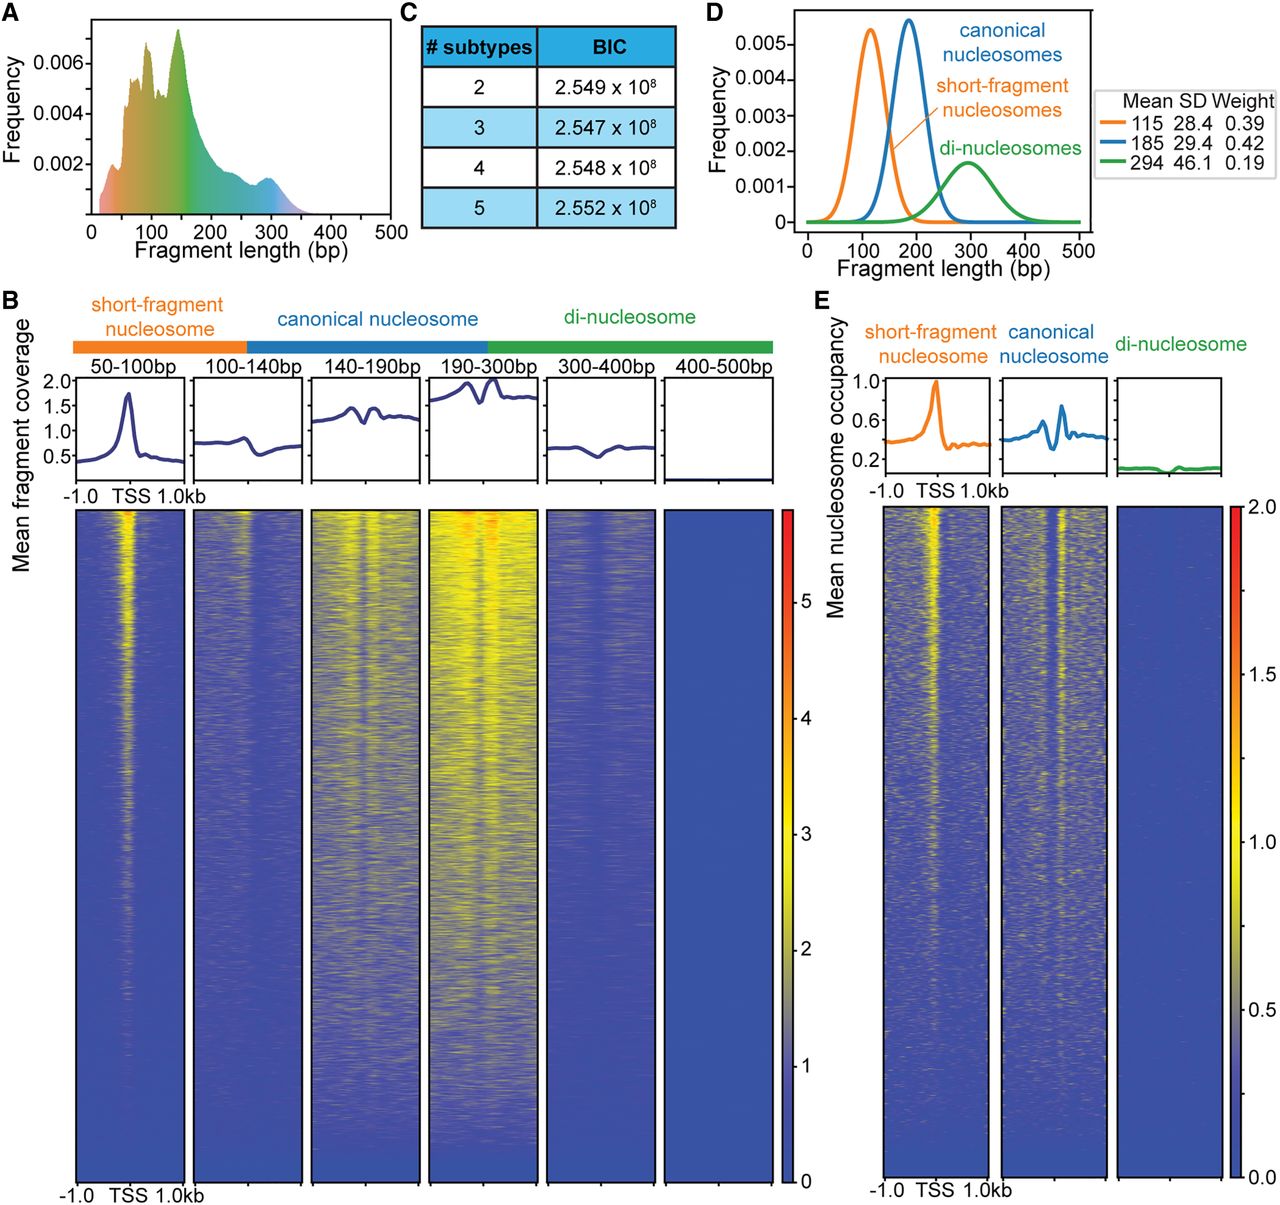
Figure 3.
SEM characterizes three nucleosome subtypes in a low-dose MNase-ChIP-seq data set from mESCs. (A) Fragment size distribution of the low-dose MNase-ChIP-seq data set. (B) Heatmap and profile plot of MNase-seq fragments split by fragment size (50–100 bp, 100–140 bp, 140–190 bp, 190–300 bp, 300–400 bp, 400–500 bp) around TSSs. (C) Bayesian information criterion (BIC) computed across varying numbers of nucleosome subtypes. (D) Fragment size distribution of each nucleosome subtype as determined by SEM. (E) Heatmap and profile plot of each SEM-defined nucleosome subtype around TSSs.


