
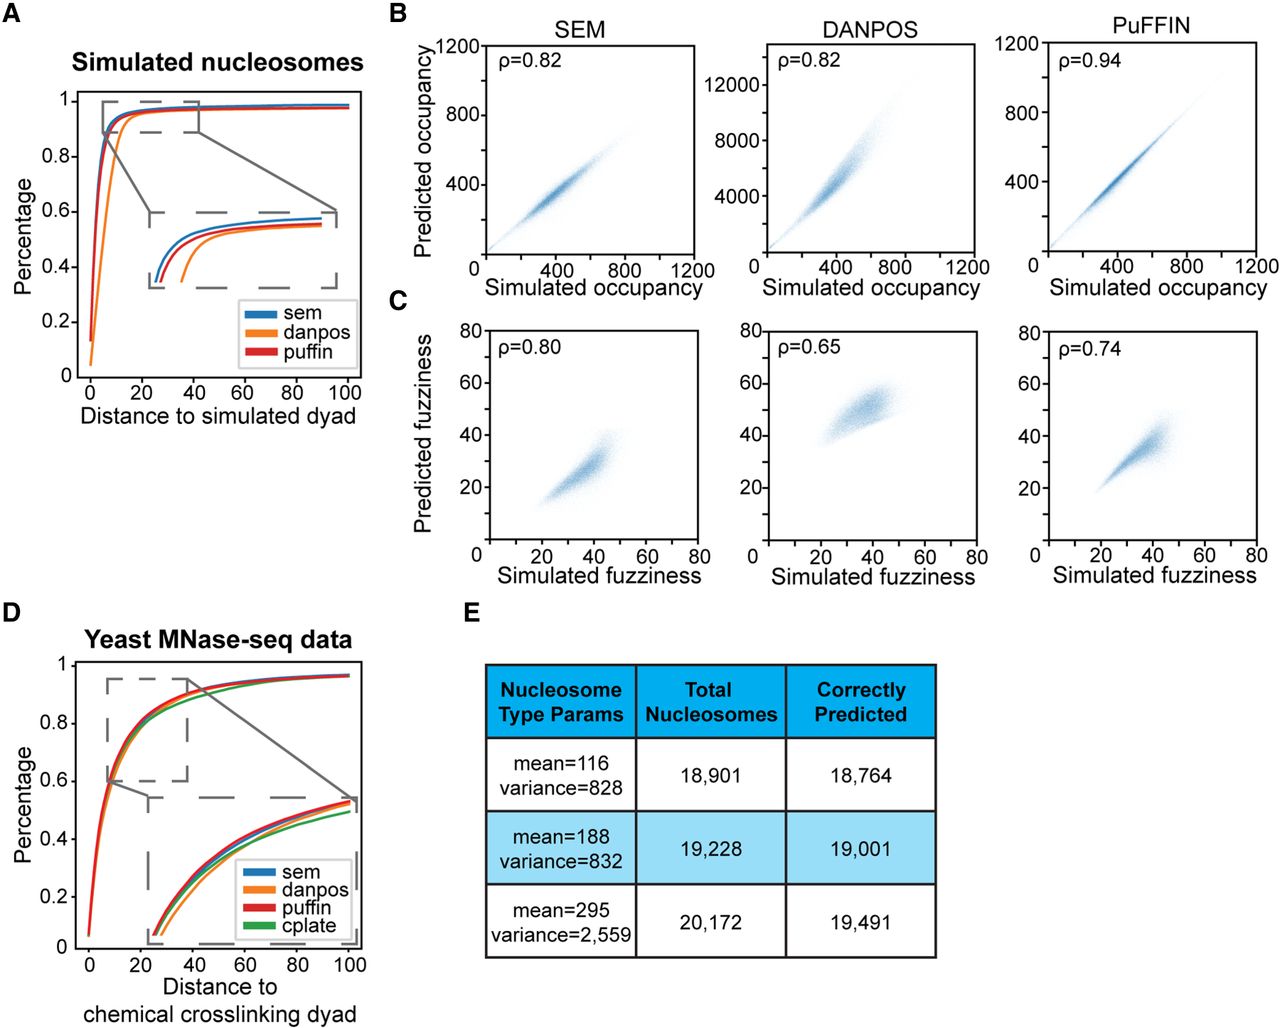
Comparison of SEM to existing nucleosome-calling packages on common metrics. (A) Cumulative percentage of distances between predicted nucleosome dyads and simulated nucleosome dyads in simulated MNase-seq data. (B) Correlation between predicted occupancy and simulated occupancy. Each simulated nucleosome is assigned to the closest predicted nucleosome for the purposes of comparison. (C) Correlation between predicted fuzziness and simulated fuzziness. Each simulated nucleosome is assigned to the closest predicted nucleosome for the purposes of comparison. (D) Cumulative percentage of distances between predicted nucleosome dyads and chemical cross-linking dyads in real MNase-seq data (Voong et al. 2016). (E) Numbers of total simulated nucleosomes and correctly predicted nucleosomes of each nucleosome subtype.


