
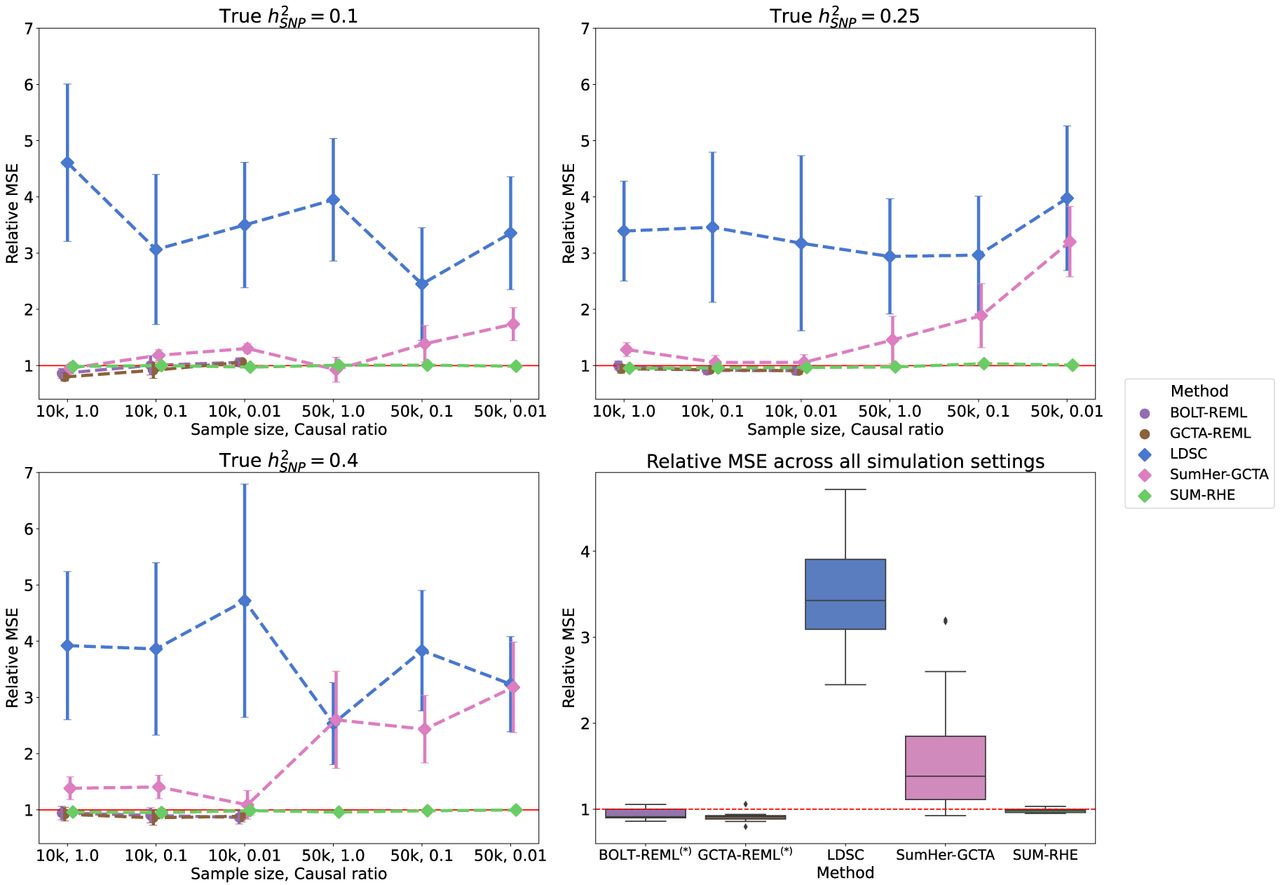
Figure 2.
Mean squared error (MSE) of heritability estimates of each method relative to RHE. The dot and error bar denote the relative MSE and the 95% CI calculated based on bootstrap resampling (using 10,000 bootstrap samples), respectively. Although the MSE of SUM-RHE is within ±5% of the MSE of RHE, the MSE of LDSC ranges from 245% to 472%, whereas the MSE of SumHer-GCTA ranges from 92% to 320%. (Diamond) BOLT-REML and GCTA-GREML have relative MSE in the range of 80% and 106% for the 10k samples and were not benchmarked on the 50k samples.


