
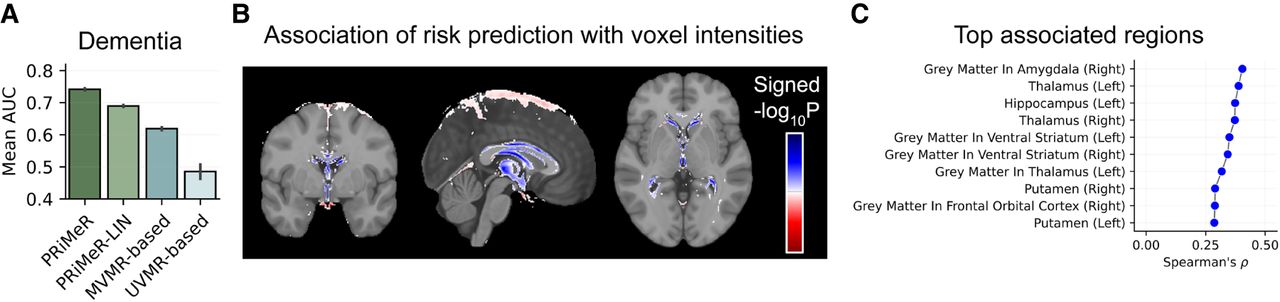
Application of PRiMeR to predict 5-year AD risk. (A) Comparative performance of PRiMeR against baseline MR models using average AUC for 5-year AD predictions using follow-up
labels. (B) Heatmap of the signed  P-value of association between voxel intensities and the AD risk predictor scores, overlayed on the MNI152 template (Miller et al. 2016; Alfaro-Almagro et al. 2018; https://www.bic.mni.mcgill.ca/ServicesAtlases/ICBM152NLin6). Areas where increased risk predictor scores correlate with significant increased (decreased) voxel intensities are highlighted
in red (blue) (Bonferroni-adjusted P < 0.05). (C) Spearman's correlation coefficients between the AD risk predictor and individual MRI traits in the validation set. Results
for the top 10 associated regions are displayed, with associations for all analyzed regions available in Supplemental Figure A7.
P-value of association between voxel intensities and the AD risk predictor scores, overlayed on the MNI152 template (Miller et al. 2016; Alfaro-Almagro et al. 2018; https://www.bic.mni.mcgill.ca/ServicesAtlases/ICBM152NLin6). Areas where increased risk predictor scores correlate with significant increased (decreased) voxel intensities are highlighted
in red (blue) (Bonferroni-adjusted P < 0.05). (C) Spearman's correlation coefficients between the AD risk predictor and individual MRI traits in the validation set. Results
for the top 10 associated regions are displayed, with associations for all analyzed regions available in Supplemental Figure A7.


