
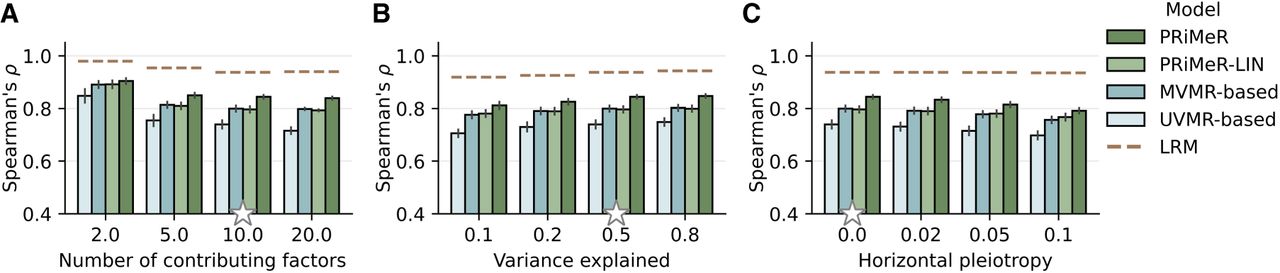
Assessment of disease risk prediction accuracy using simulated data. Comparison of model accuracy in recovering the simulated aggregate risk factor measured by Spearman's correlation coefficient. Compared are PRiMeR, its linear variant (PRiMeR-LIN), a predictor based on multivariable MR (MVMR-based), a predictor based on univariate MR (UVMR-based), and the supervised model accessing individual-level follow-up labels (LRM; Methods), varying the number of contributing risk factors (A), the fraction of outcome variance explained by the risk factors (B), and the fraction of outcome variance explained by horizontal pleiotropy (C). Stars denote standard values held constant while other parameters were varied. Error bars indicate standard errors across 10 replicate experiments.


