
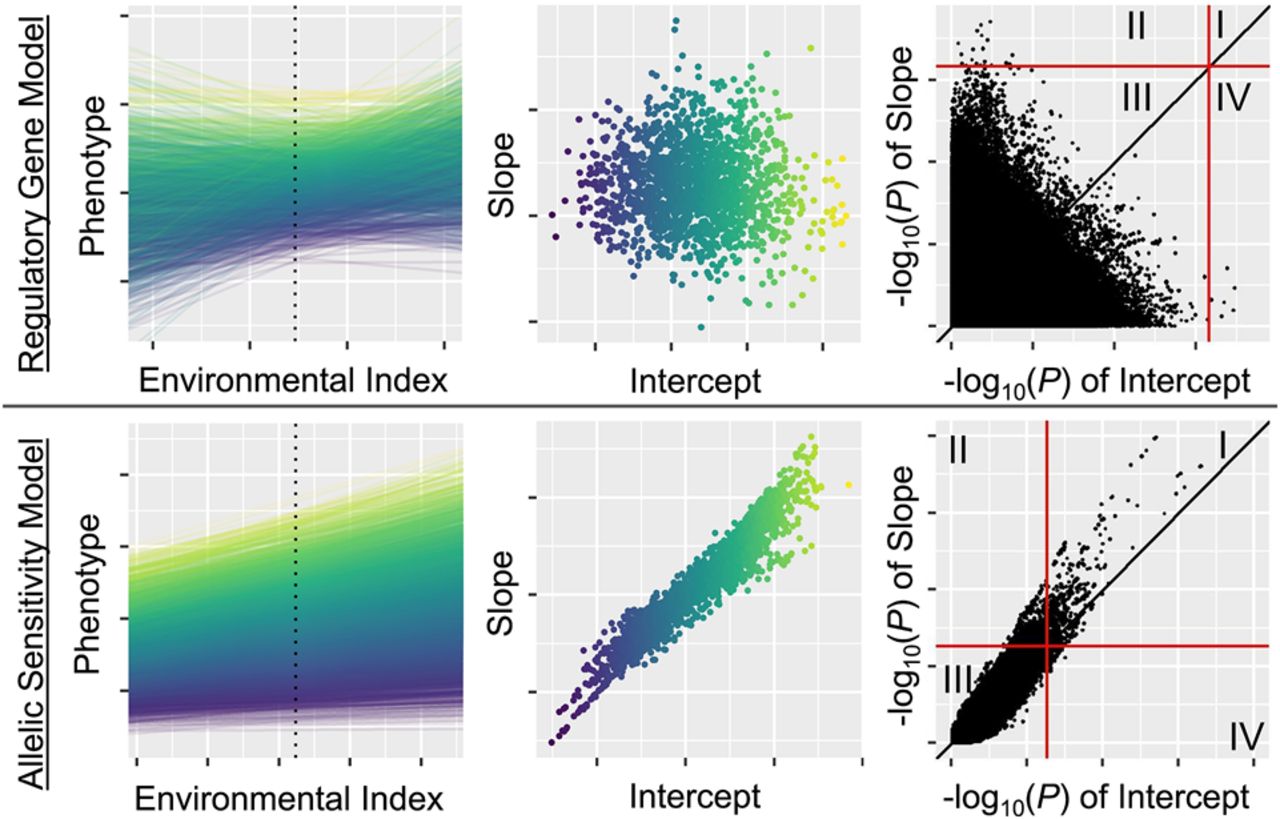
Conceptual visualization of two extreme cases along a continuum of genetic architecture of phenotypic plasticity: examples of a trait entirely following the regulatory gene model (top) and allelic sensitivity model (bottom) of phenotypic plasticity. (Left column) Reaction norms of phenotype across the environmental index; each line represents a single genotype, colored by genotypic mean (intercept). Dashed line indicates where the genotypic mean (intercept) is measured: the mean environmental index value across observed environments. (Middle column) Slope versus intercept values from these reaction norms; each point represents a single genotype, colored by genotypic mean (intercept). (Right column) −log10(P)-values from GWAS of slope (y-axis) and intercept (x-axis). Red lines show GWAS significance threshold, and the black line is x = y; quadrants I–IV are labeled.


