
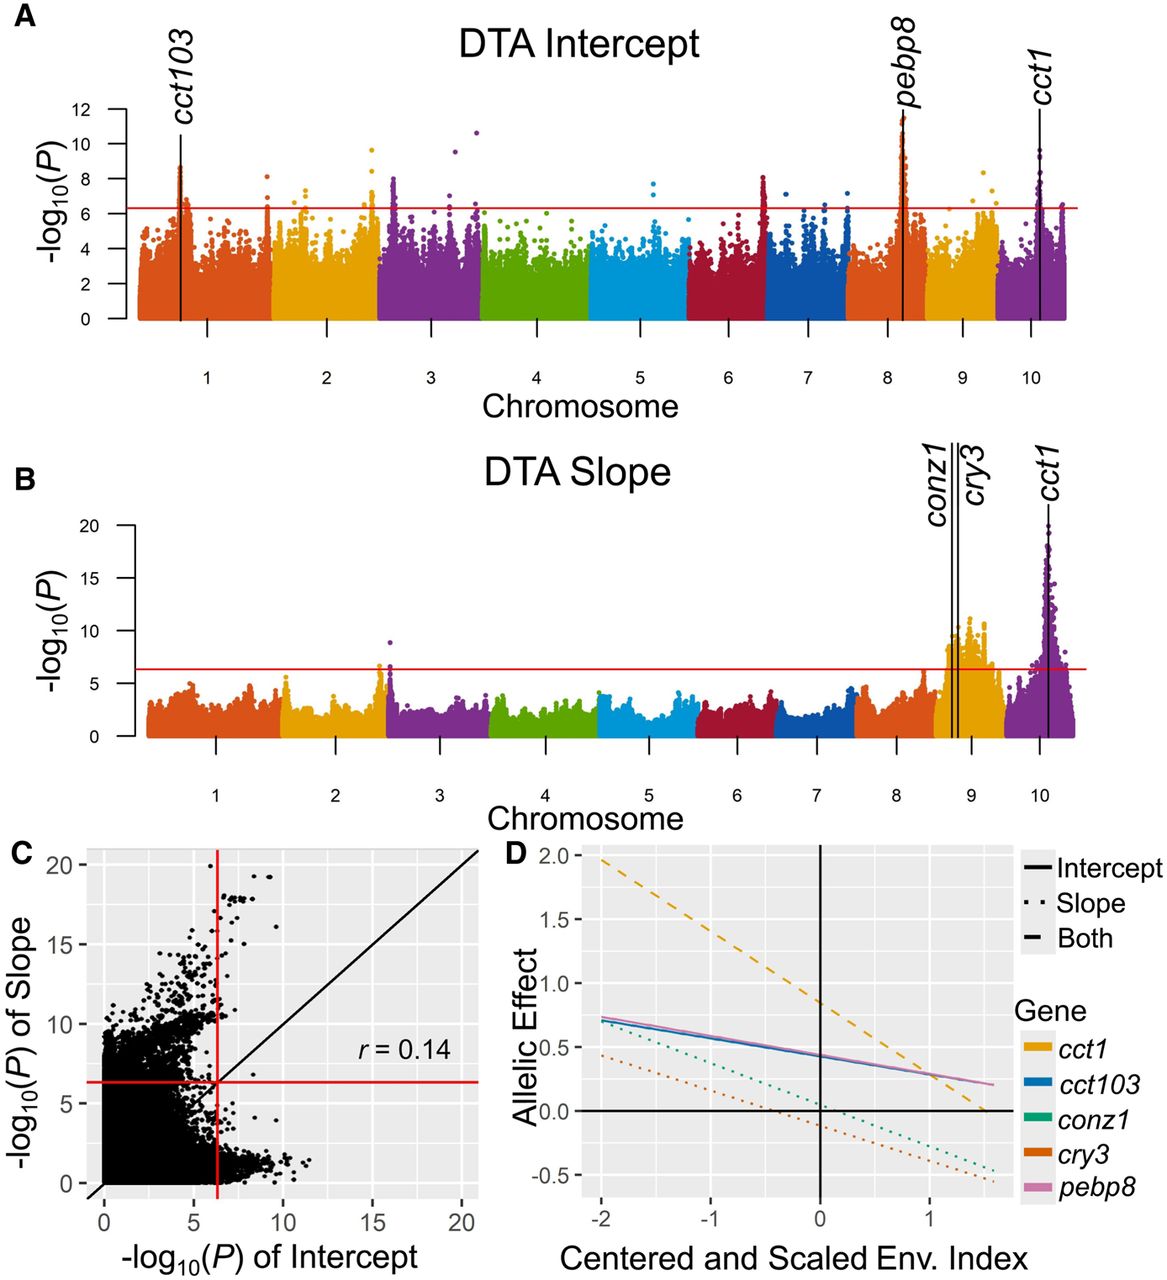
Figure 4.
GWAS results for DTA. Manhattan plots of DTA intercept (genotypic mean; A) and slope GWAS (B) results with selected candidate genes labeled. Red lines indicate the SimpleM significance threshold (α = 0.05). (C) The −log10(P)-values of genome-wide markers from GWAS of DTA slope versus intercept. (D) Allelic effects of selected candidate genes identified for the DTA intercept, slope, or both across environmental index values.


