
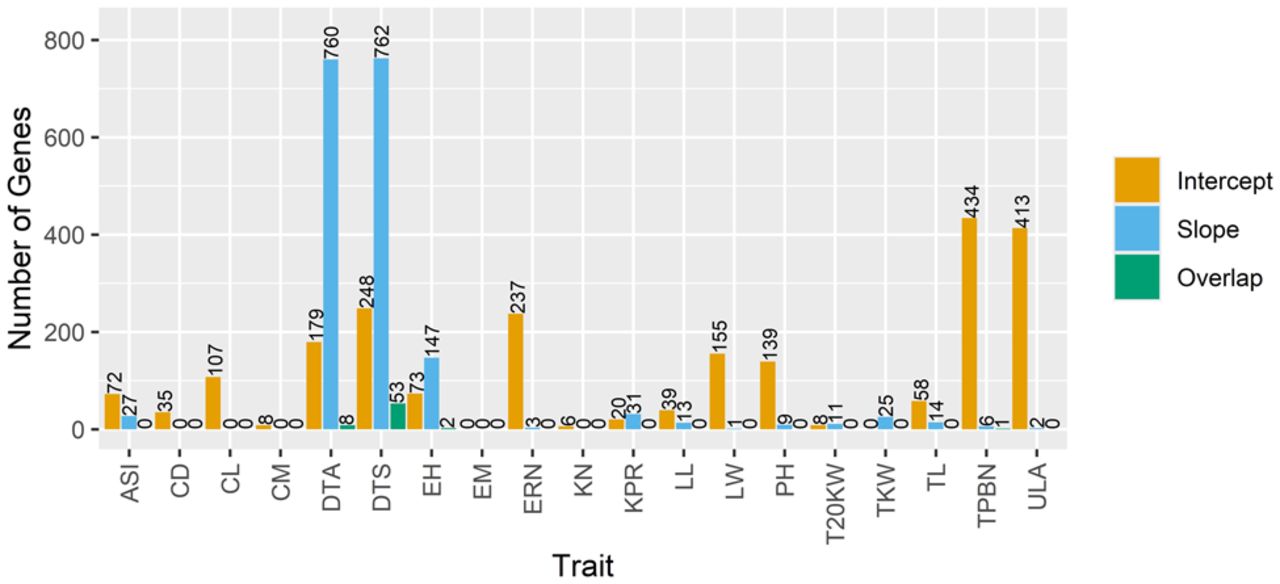
Figure 3.
The number of candidate genes for each trait shows the varying genetic architectures of plasticity across traits. Candidate genes were identified as those within a 20 kb window surrounding each significant marker. All genes identified for intercept are shown in orange, all identified for slope are shown in blue, and the genes found in both the slope and intercept GWASs are shown in green.


