
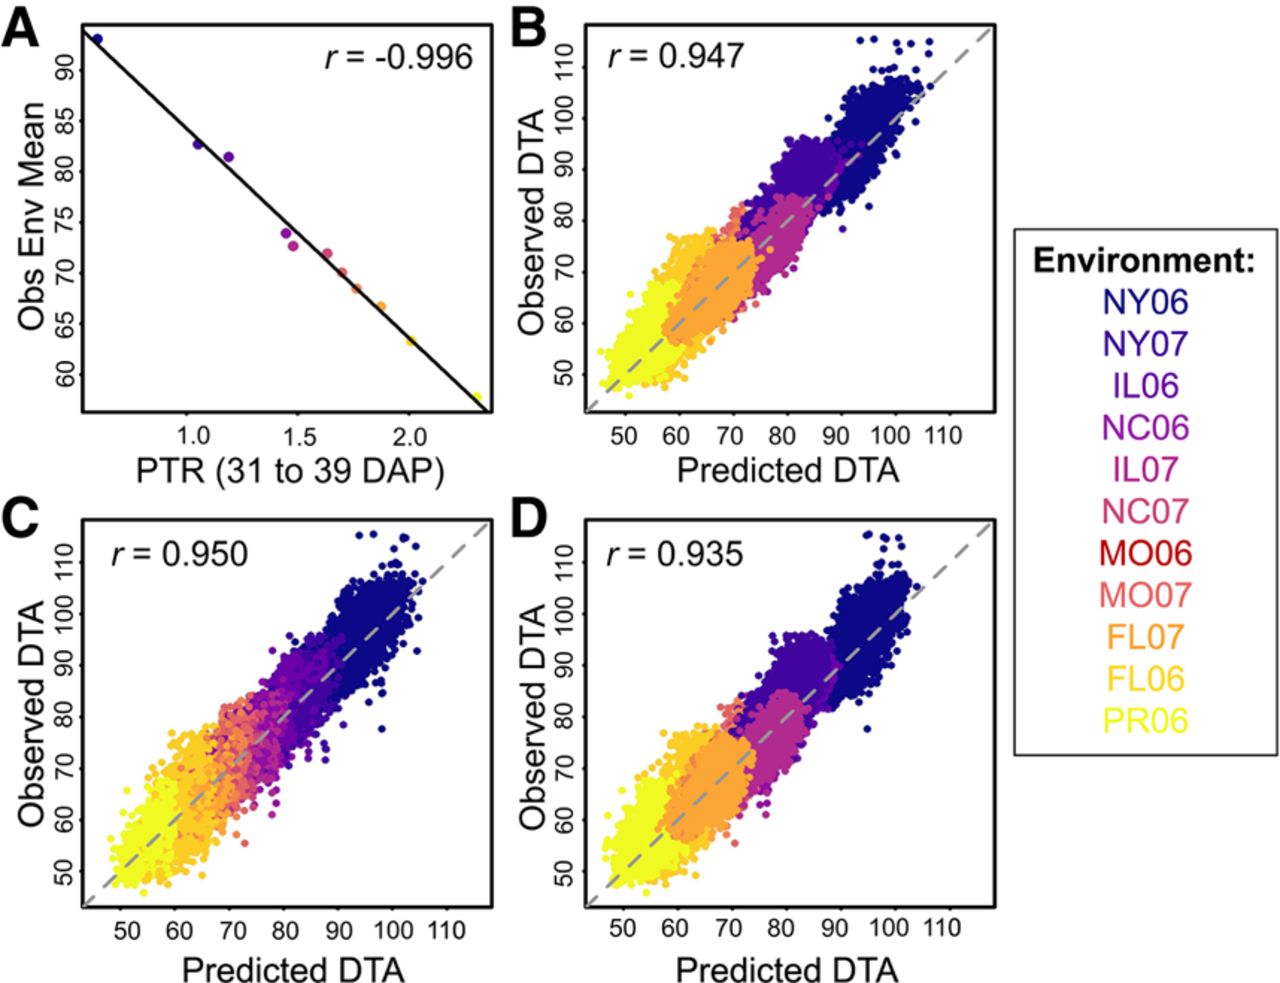
Figure 2.
CERIS and prediction results for days to anthesis (DTA). (A) Identified environmental index of photothermal ratio (PTR) measured from 31 to 39 days after planting (DAP) is highly correlated with the observed environmental mean (Obs Env Mean). Representative examples of one-to-two prediction (B), one-to-three prediction (C), and one-to-four prediction (D).


