
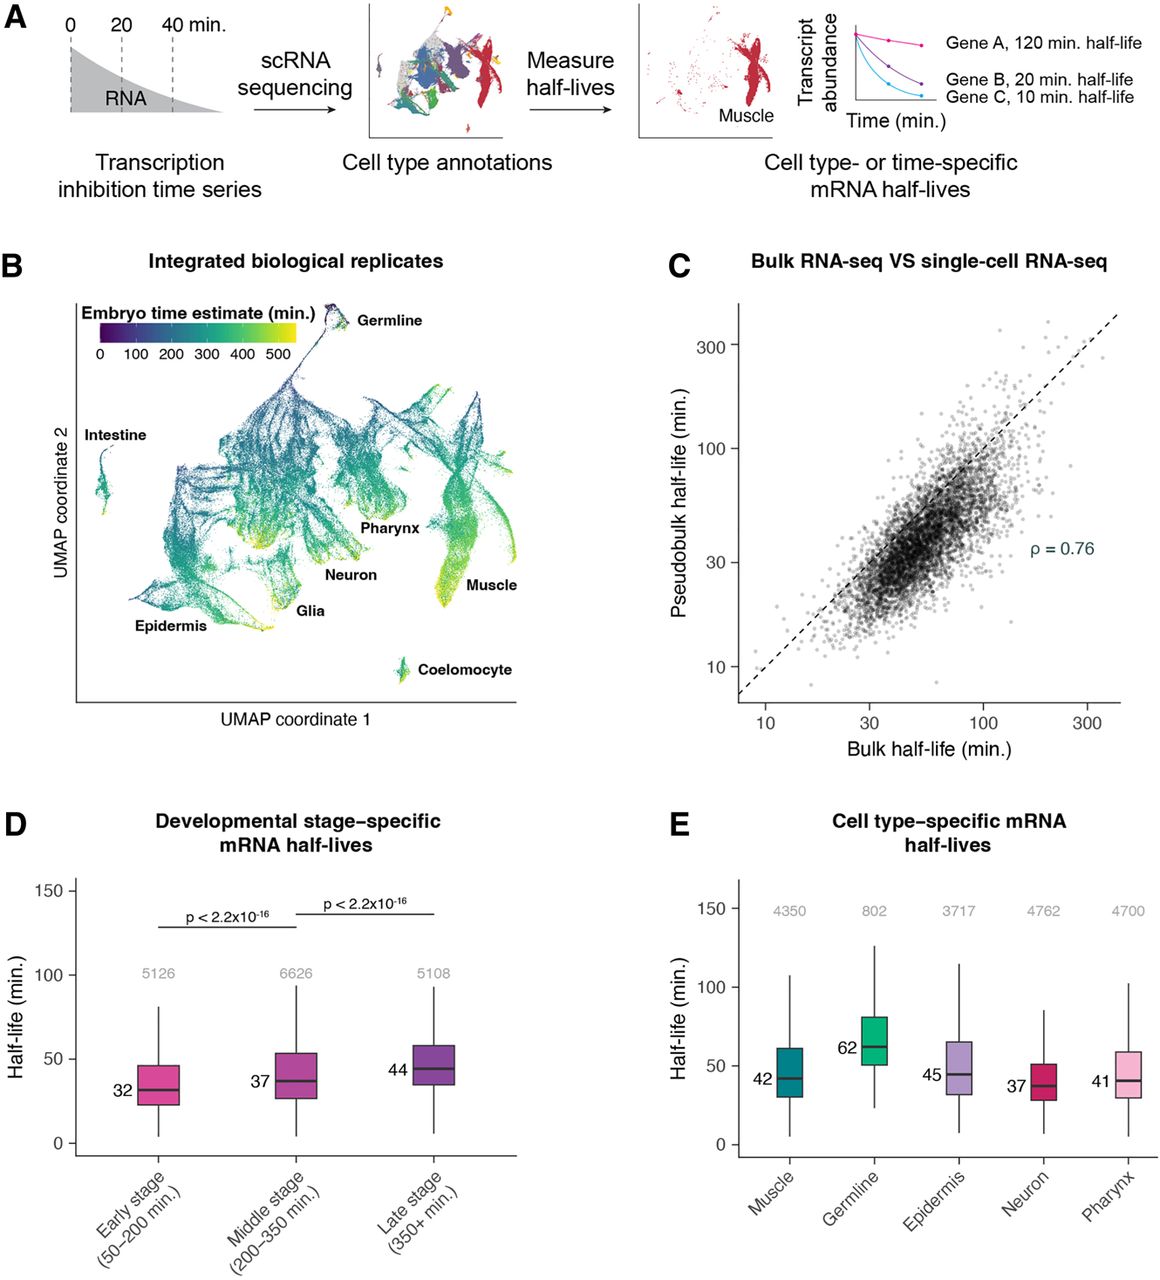
Single-cell RNA sequencing allows measurement of mRNA half-lives at high resolution throughout C. elegans embryogenesis. (A) A schematic representation of the approach to measure mRNA half-lives in the C. elegans embryo using transcription inhibition and single-cell RNA sequencing. (B) UMAP projection of the integrated data set of three biological replicates. Cells are colored by the age of the embryo from which a cell was produced, estimated from correlations to a whole-embryo RNA sequencing time series (Hashimshony et al. 2015). Trajectories corresponding to major cell types are labeled. (C) Scatter plot comparing the mRNA half-lives calculated in pseudobulk from the single-cell data and the half-lives calculated from the bulk-cell data on a log-log scale. Spearman's correlation coefficient = 0.76. Dashed line is the x = y line. (D) Box plots showing the stage-specific mRNA half-life distributions of genes within early-, middle-, and late-stage cells (50–200, 200–350, and 350+ min after the four-cell embryo stage, respectively). (E) Box plots showing the cell type–specific mRNA half-life distributions of genes within muscle, germline, epidermis, neuron, and pharynx. Numbers to the left of the box plots are median half-lives within each group. Numbers above the box plots are the number of genes within each group. P-values comparing median half-lives were calculated using the Wilcoxon rank-sum test. Outliers are not shown: From left to right for D, 203, 345, and 323 genes within each group had mRNA half-lives >100 min; from left to right for E, 141, 36, 150, 70, and 125 genes within each group had mRNA half-lives >150 min.


