
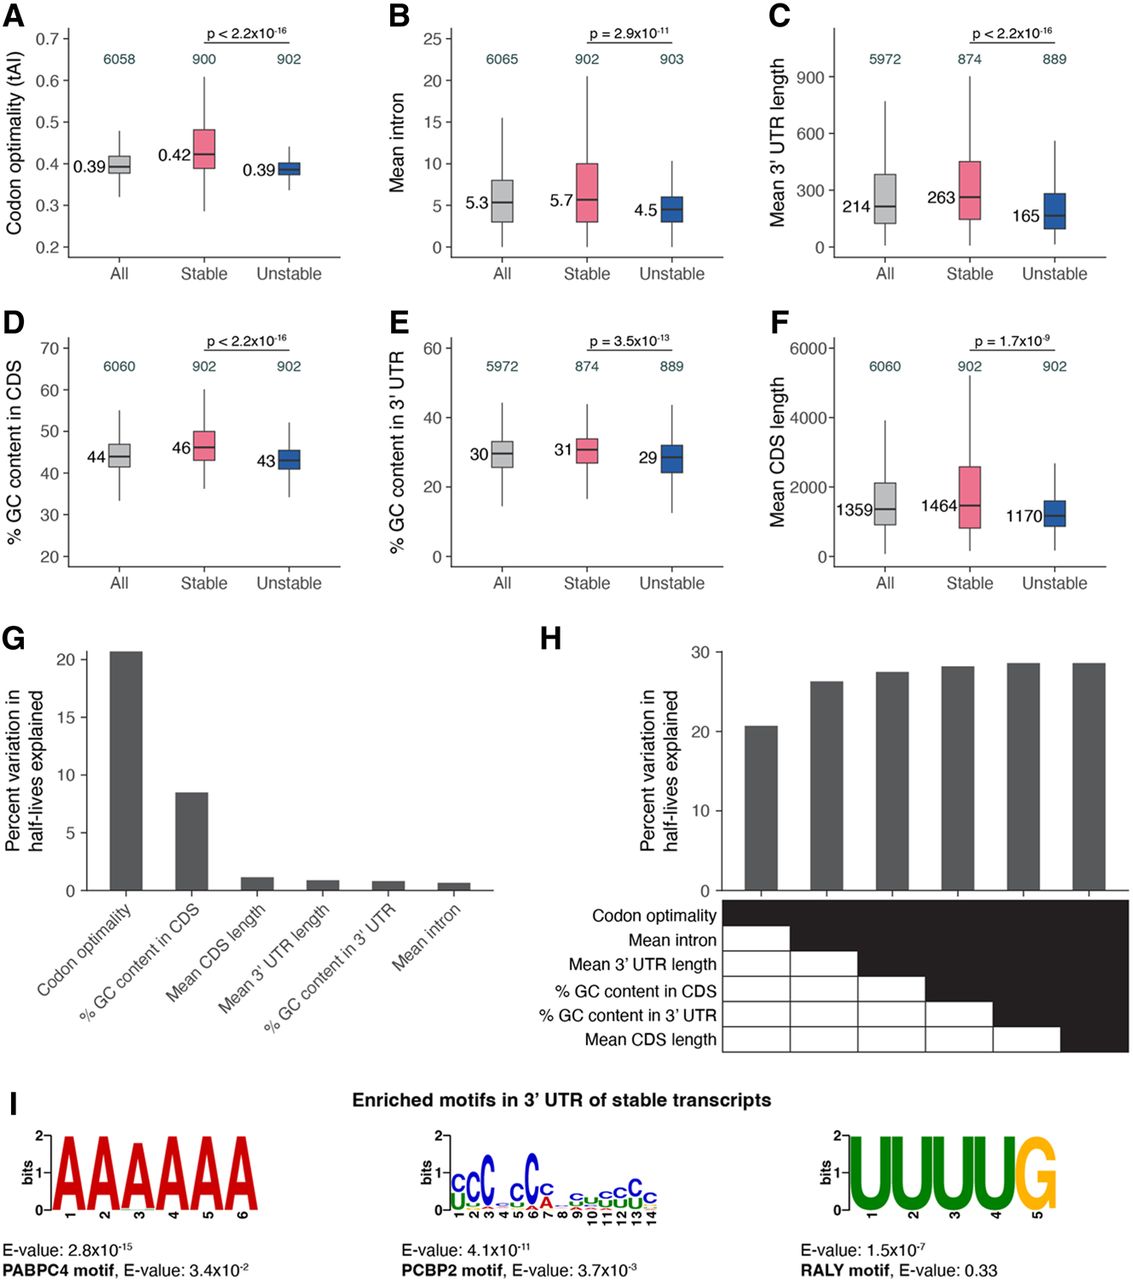
Transcript stability correlates with specific sequence features. The relationship between transcript stability and different sequence features was examined using the top 15% stable and unstable transcripts identified in our bulk RNA sequencing data. The box plots compare different features between all, stable, and unstable transcripts. Numbers to the left of the box plots are median values within each group. Numbers above the box plots are the number of genes within each group. P-values comparing median values were calculated using the Wilcoxon rank-sum test. Outliers are not shown. (A) Distribution of codon optimality scores, as measured using tRNA adaptation index (tAI) values for each gene. Higher tAI values correspond to greater codon optimality. (B) Distribution of the number of introns averaged across all splice isoforms of a gene. (C) Distribution of 3′ UTR length averaged across all 3′ UTR isoforms of a gene. (D) Distribution of the percentage of GC content in the coding sequence of genes. For genes with multiple coding sequence isoforms, the longest isoform was used. (E) Distribution of the percentage of GC content in the 3′ UTR of genes. For genes with multiple 3′ UTR isoforms, the longest isoform was used. (F) Distribution of coding sequence length averaged across all splice isoforms of a gene. (G) Linear regression was used to identify the percentage of variation in mRNA half-lives explained by individual sequence features. (H) Multiple linear regression was used to identify the percentage of variation in mRNA half-lives explained by combinations of different sequence features. (I) MEME (Bailey et al. 2015) identified three motifs enriched in the 3′ UTRs of the top 15% stable transcripts compared with the 3′ UTRs of the top 15% unstable transcripts. For genes with multiple 3′ UTR isoforms, the longest isoform was used. The best match of each de novo motif to known motifs in mammals (Ray et al. 2013) is noted.


