
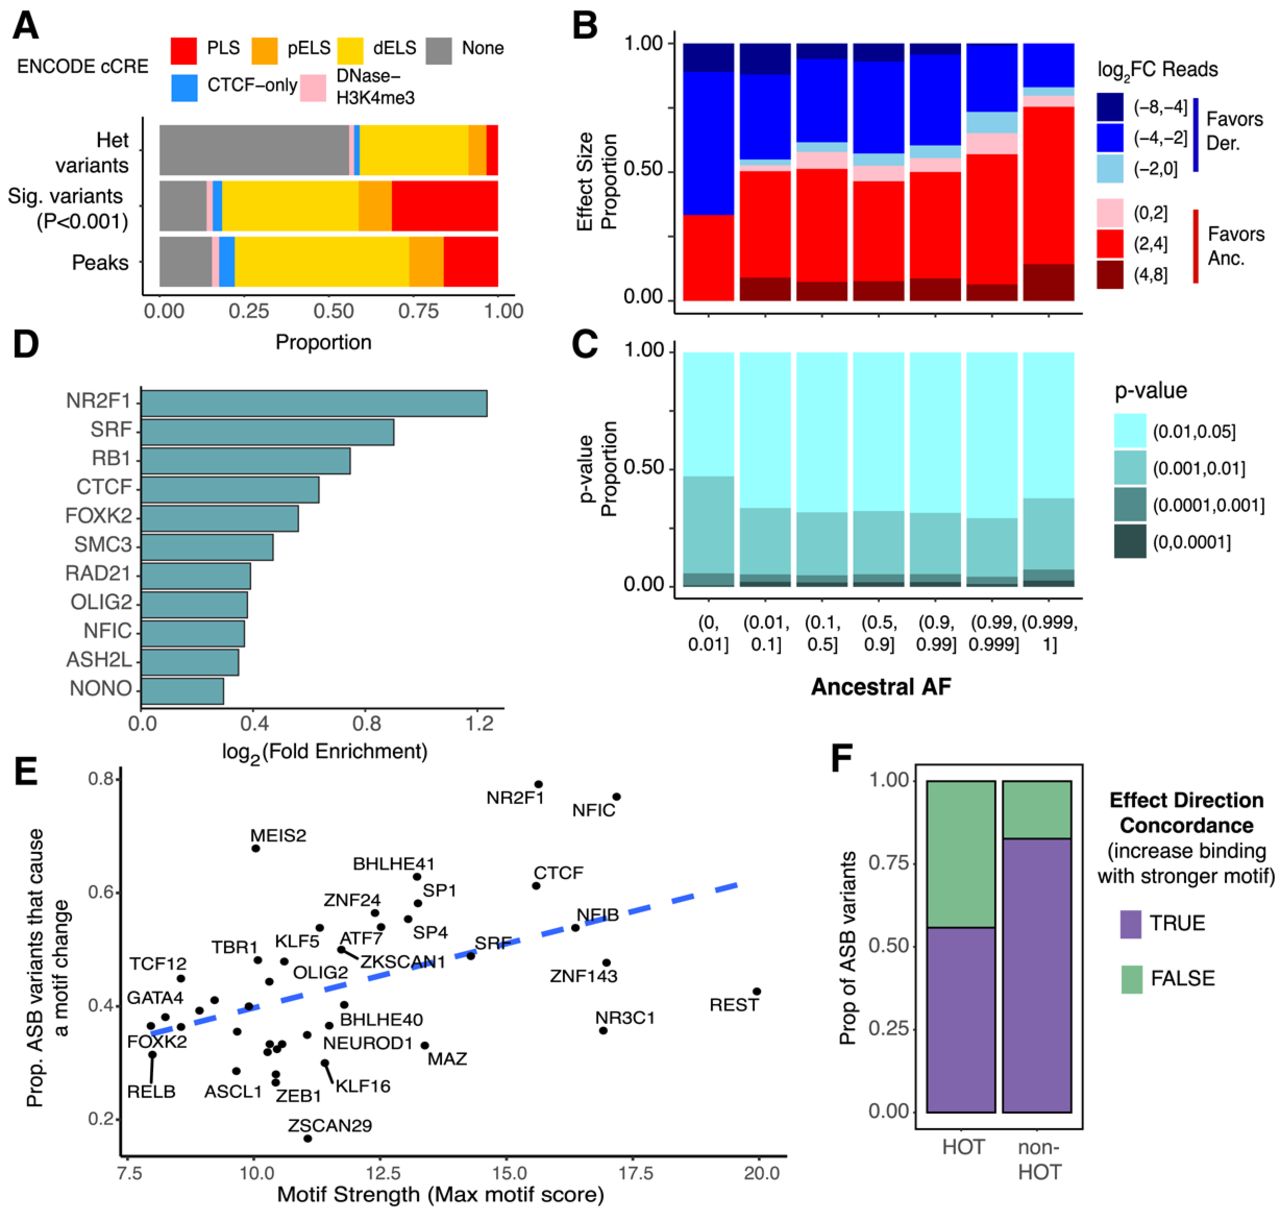
Genetic and genomic properties of ASB variants. (A) Stacked bar plots showing the fraction of regions which overlap a particular cCRE annotation for all heterozygous variants (top), ASB variants (middle), and all TF peaks (bottom). Red indicates promoter-like signal (PLS); orange, proximal enhancer-like signal (pELS); yellow, distal enhancer-like signal (dELS); blue, CTCF-only; pink, DNase-H3K4me3; and gray, non-cCRE regions. (B) Bar plot showing the proportion of ASB variants (P < 0.001) favoring the ancestral and derived allele and the degree of the allele preference [log2(Anc. count + 1/Der. count + 1)] for varying ranges of AAF. (C) For varying ranges of AAF (x-axis), we show the fraction of ASB variants found in each P-value range (y-axis). (D) The log2 fold enrichment (FE) for variants with a GERP-score > 4. The background for each TF is the nonsignificant heterozygous variants with a read depth greater than 11 for the corresponding TF. Only TFs with a chi-squared P-value < 0.01 are shown. (E) For each TF, the proportion of ASB variants that significantly alter a JASPAR motif (motifbreakR P-value < 0.0001) versus the maximum motif score for the PFM. Dashed line indicates the best fit line. (F) The proportion of ASB events that agree with the direction of the motif change in HOT sites versus non-HOT sites.


