
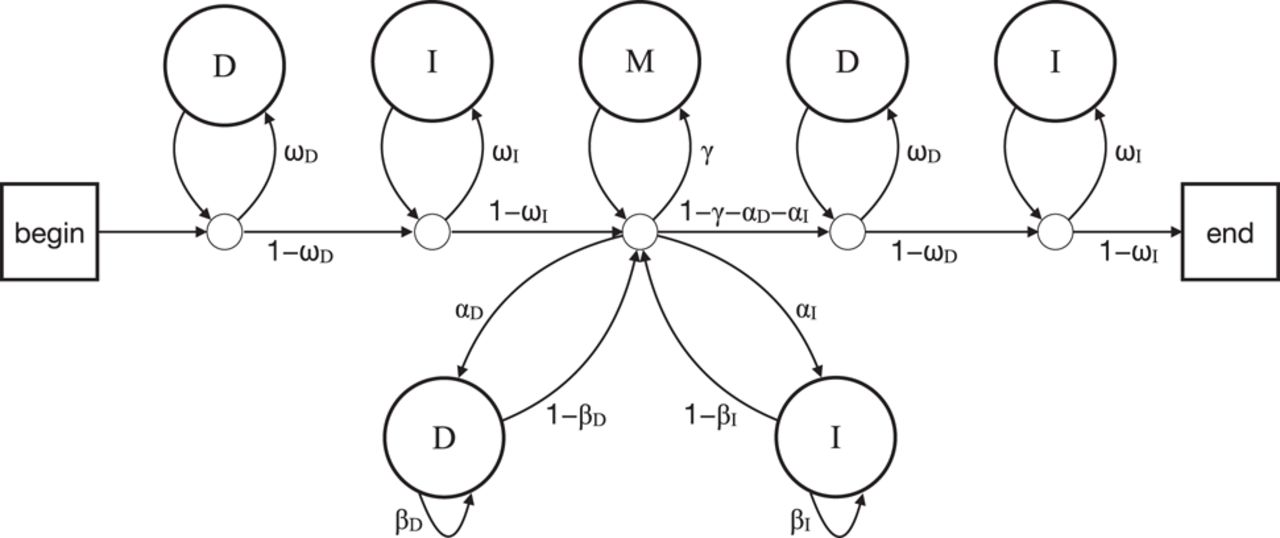
Figure 2.
A probability model for two sequences with a related region. The model produces different alignments with different probabilities. Starting at “begin,” the arrows are followed according to their probabilities (e.g., ωD vs. 1 − ωD). Each pass through a D state produces an unaligned letter x in one sequence (R), with the probabilities ϕx. Each pass through an I state produces an unaligned letter y in the other sequence (Q), with the probabilities ψy. Each pass through M generates two aligned letters, x in R and y in Q, with the probabilities πxy.


