
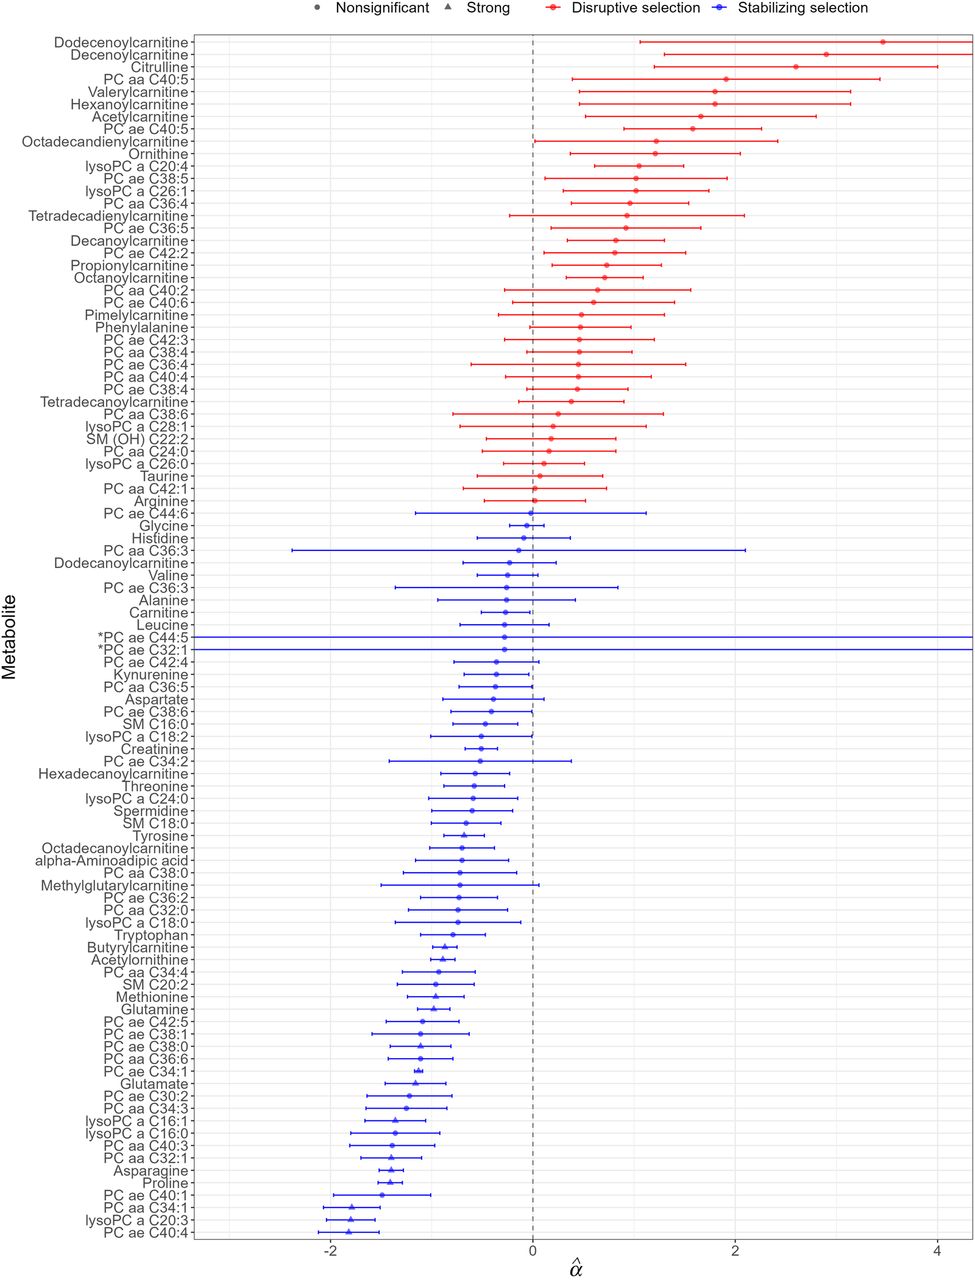
Figure 1.
Metabolites with selection estimates showing stabilizing selection ( < 0) and disruptive selection (
 > 0). Circle symbols represent nonsignificant selection estimates; triangles refer to metabolites with a selection strength
P-value surviving multiple testing correction (P < 0.05/97). Error bars represent SEs. Metabolites showing exceptionally large SEs are indicated by an asterisk, such as PC
ae C32:1 (SE = 98.5) and PC ae C44:5 (SE = 86.1).
> 0). Circle symbols represent nonsignificant selection estimates; triangles refer to metabolites with a selection strength
P-value surviving multiple testing correction (P < 0.05/97). Error bars represent SEs. Metabolites showing exceptionally large SEs are indicated by an asterisk, such as PC
ae C32:1 (SE = 98.5) and PC ae C44:5 (SE = 86.1).


