
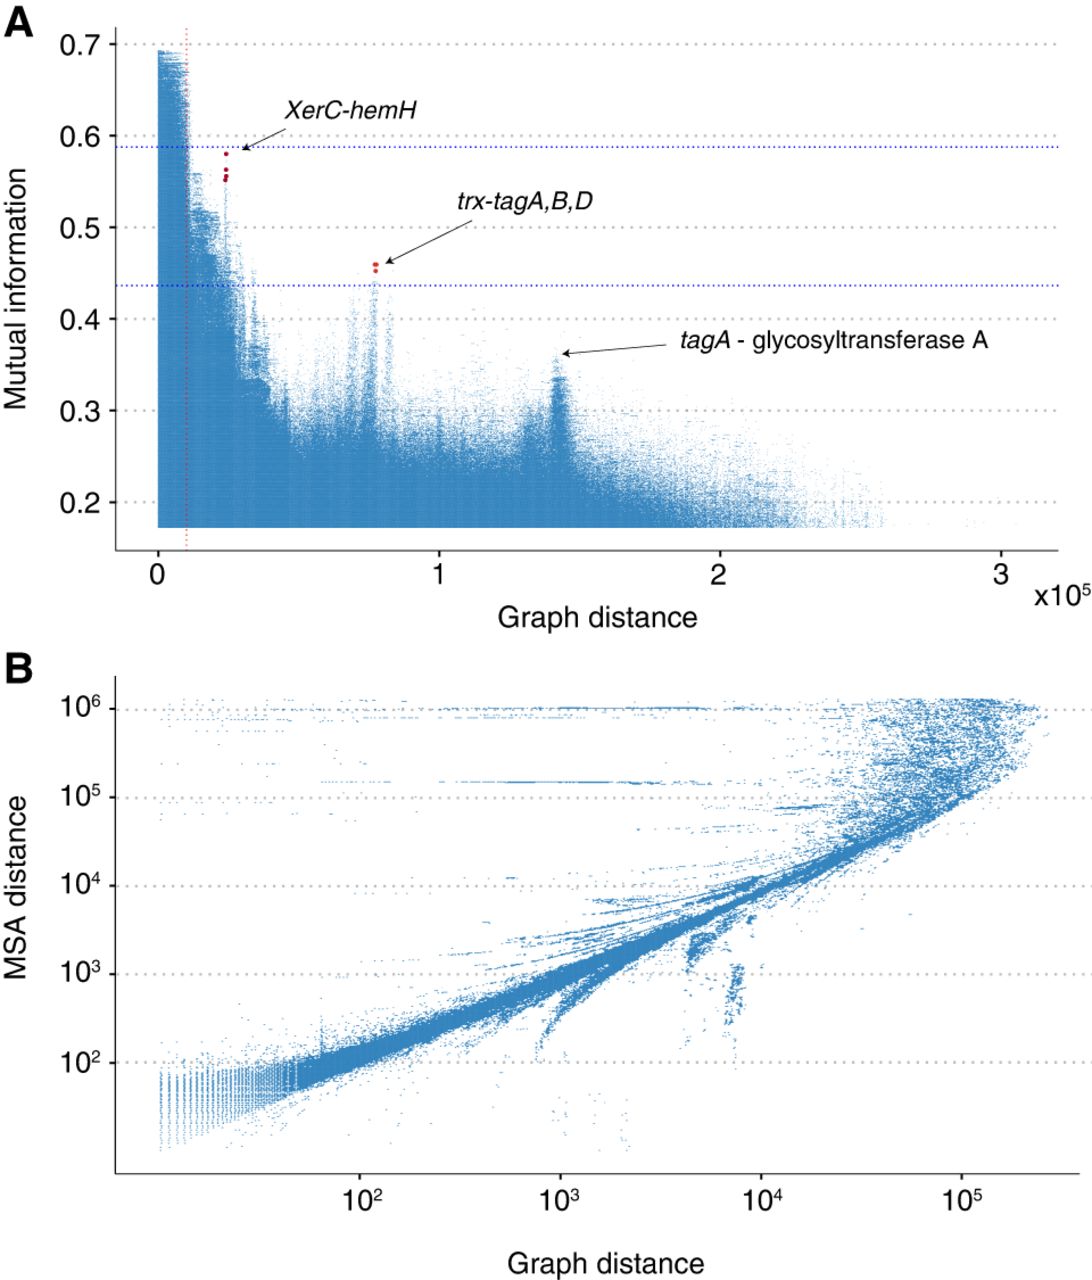
Analysis of long-read E. faecalis assemblies. (A) A Manhattan plot indicating the strength of LD measured using MI versus the genomic distance in the graph. Unitig pairs with an average distance exceeding the standard deviation of their distances have been filtered out. Strong links of coselection were identified between an intergenic region adjacent to the trxB gene and the three genes tagA, -B, and -D in addition to a link between a site-specific XerC family tyrosine recombinase and an intergenic region between a tRNA gene and a ferrochelatase-encoding hemH. The vertical red line indicates the distance threshold below which it is difficult to distinguish outlier peaks from the background LD distribution. Pairs with MI values significantly above the background at a given distance are likely to be impacted by either epistasis or coselection. (B) Pairwise distances between loci within a single genome and those found using the PAN-GWES graph-based approach. The correlation, particularly over shorter distances, indicates that the PAN-GWES algorithm can accurately distinguish LD driven by proximity within the genome from LD indicative of coselection or epistasis. The horizontal lines are caused by k-mers associated with mobile elements that appear in different locations within each genome but are fixed within the single reference.


