
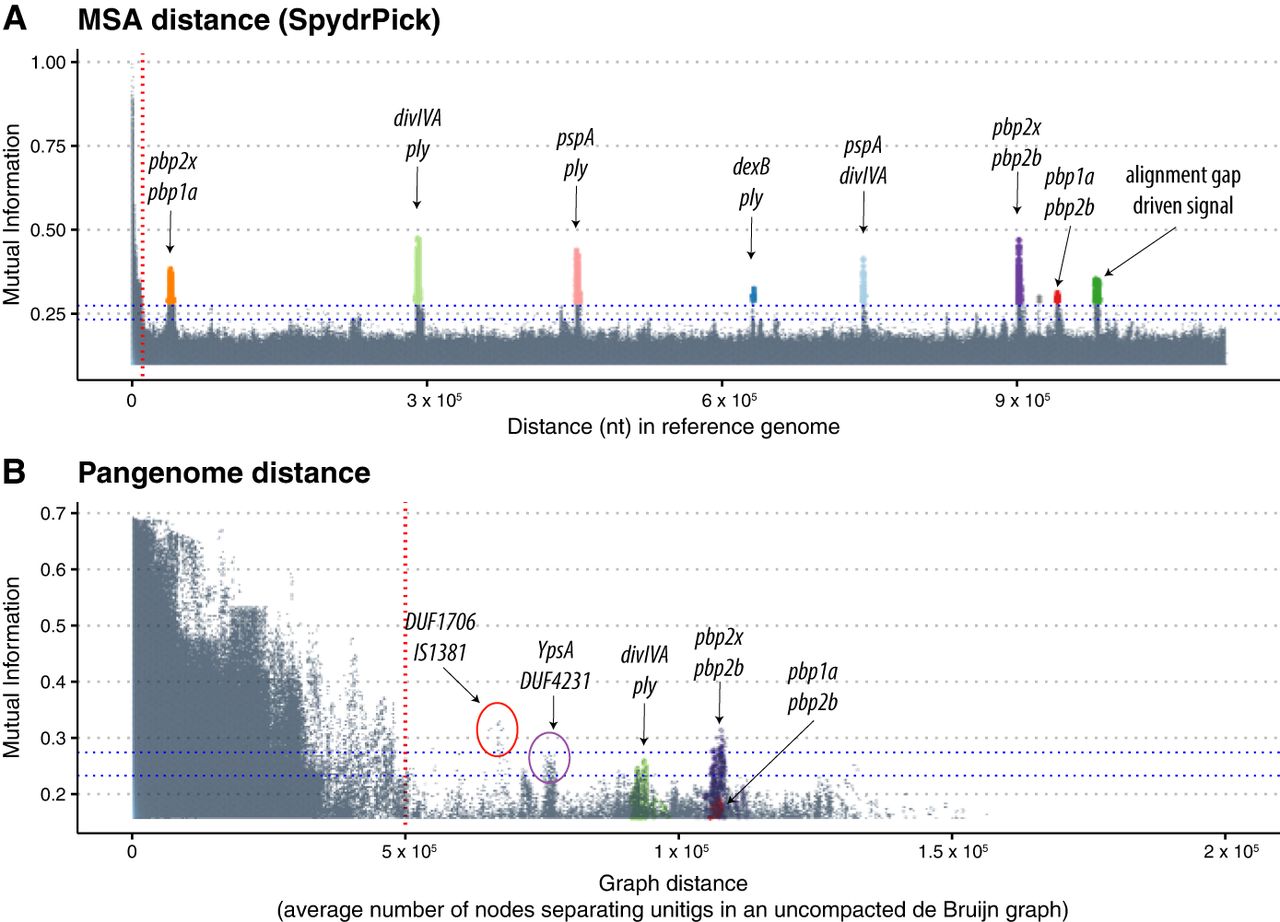
Manhattan plots indicating the strength of linkage disequilibrium (LD), using MI, versus the distance separating loci using a single reference and the SpydrPick algorithm (A) and the PAN-GWES algorithm (B). Separate colors are given to each link and are consistent between the plots. Unitig pairs with an average distance exceeding the standard deviation of their distances have been filtered out in the PAN-GWES results. Despite the highly fragmented nature of the data set reducing the sensitivity of the PAN-GWES approach, similar signals of coselection between the penicillin binding proteins were observed. The strongest link was observed in the PAN-GWES approach (red circle) between a DUF1706 domain–containing protein and the putative insertion sequence IS1381. In addition, the link between ypsA and a DUF4231-containing protein (purple circle) was obscured when relying on a single-reference genome, as the location of the insertion sequence varies considerably and DUF4231 is part of the accessory genome. The horizontal blue lines in the graph represent the “outlier” and “extreme outlier” thresholds inferred using Tukey's method (Methods). Points above these lines, which are separate from the large cluster driven by LD on the left side of both plots, can be interpreted as strong signals of coselection or epistasis. The green points in A, driven by gaps in alignment with the reference genome, would be represented as unitig-presence and -absence patterns in the graph-based approach. These signals did not appear in the PAN-GWES method, suggesting that they are likely caused by misalignment to the reference genome rather than by the actual presence or absence of sequence.


