
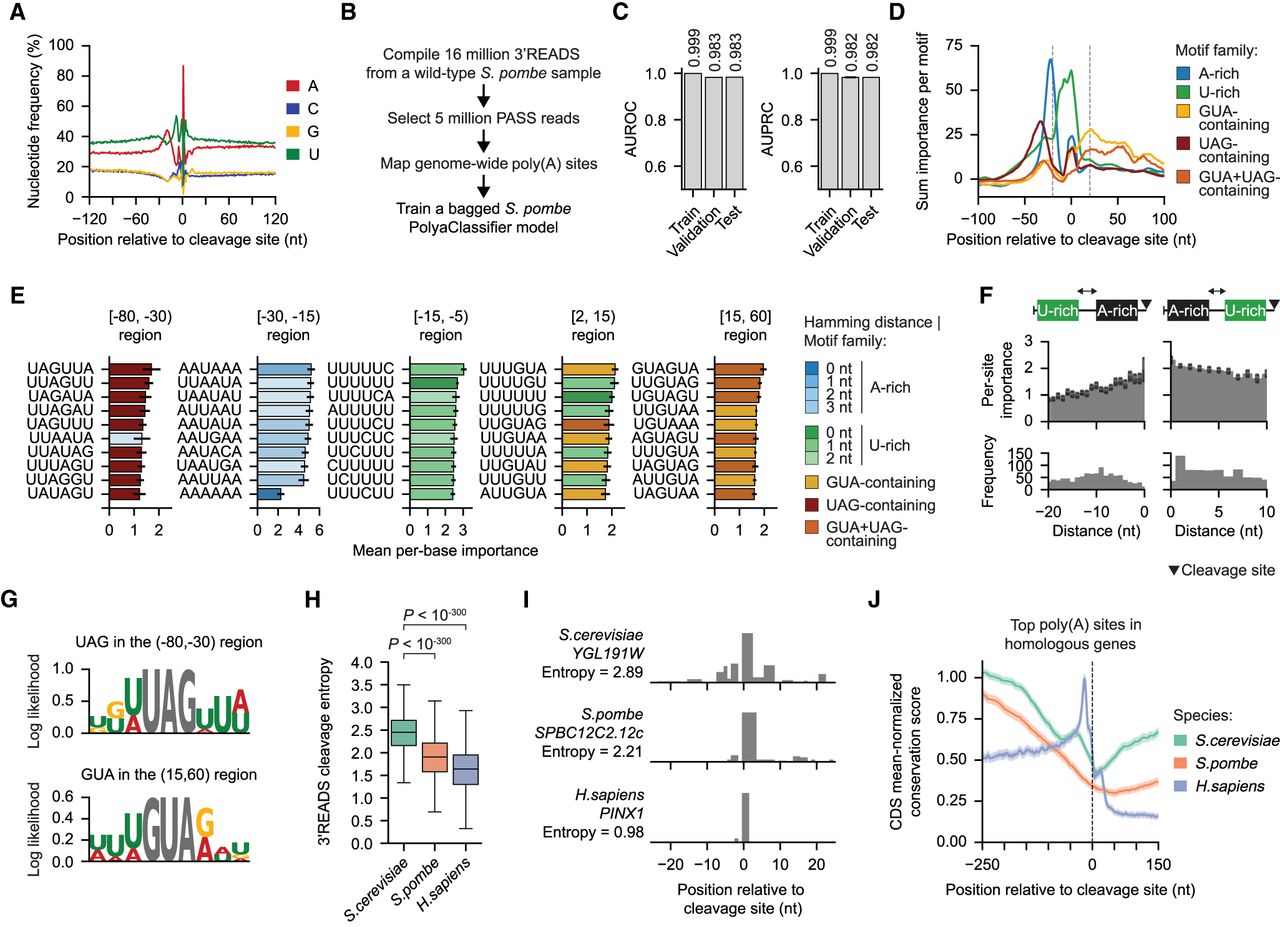
The S. pombe PolyaClassifier model reveals divergent motifs mediating poly(A) site definition. (A) Distribution of nucleotide frequency surrounding the representative cleavage sites in S. pombe. (B) Overview of the data processing workflow to train the S. pombe PolyaClassifier model. (C) The AUROC and AUPRC values showing the constituent model performance for the training, validation, and testing sets. (D) The per-motif sum classification importance profiles centered at the maximum cleavage site (N = 63 A-rich, 87 U-rich, 23 GUA-containing, 19 UAG-containing, and 11 GUA + UAG-containing motifs). (E) Bar plots showing the per-site importance of the top 10 motifs in each region surrounding the maximum cleavage site. Bars are colored by the family to which the motif belongs. Data are presented as the mean and the 95% confidence interval (error bar). Only motifs present in ≥1% of well-expressed sites used in the analysis were included. (F) The per-site importance (top) and frequency (bottom) for U-rich motifs grouped by their distance upstream of (left) or downstream from (right) the A-rich motif. Data are presented as the mean and the 95% confidence interval (error bar). (G) The position-weight matrices showing the log-likelihood of the importance of nucleotides surrounding UAG and GUA 3-mers. For the detailed calculation, see Methods. (H) The distribution of 3′READS cleavage entropy values for the top poly(A) site in each gene homologous across S. cerevisiae, S. pombe, and H. sapiens (N = 3296, 2720, and 3777, respectively). The P-values from the Wilcoxon rank-sum tests comparing S. cerevisiae to S. pombe and H. sapiens are shown. (I) An example of the PASS read distribution ±25 nt surrounding the top-expressed poly(A) site in homologous genes: S. cerevisiae gene YGL191W, S. pombe gene SPBC12C2.12c, and H. sapiens gene PINX1. The cleavage entropy value calculated from the 3′READS for each species is shown. (J) A metaplot showing the conservation score for the [–250,150] nt surrounding the top-expressed poly(A) site in all homologous genes across the three species. The conservation score was normalized to the mean score in coding regions. The data are shown as the mean with the shaded region indicating the 95% confidence interval.


