
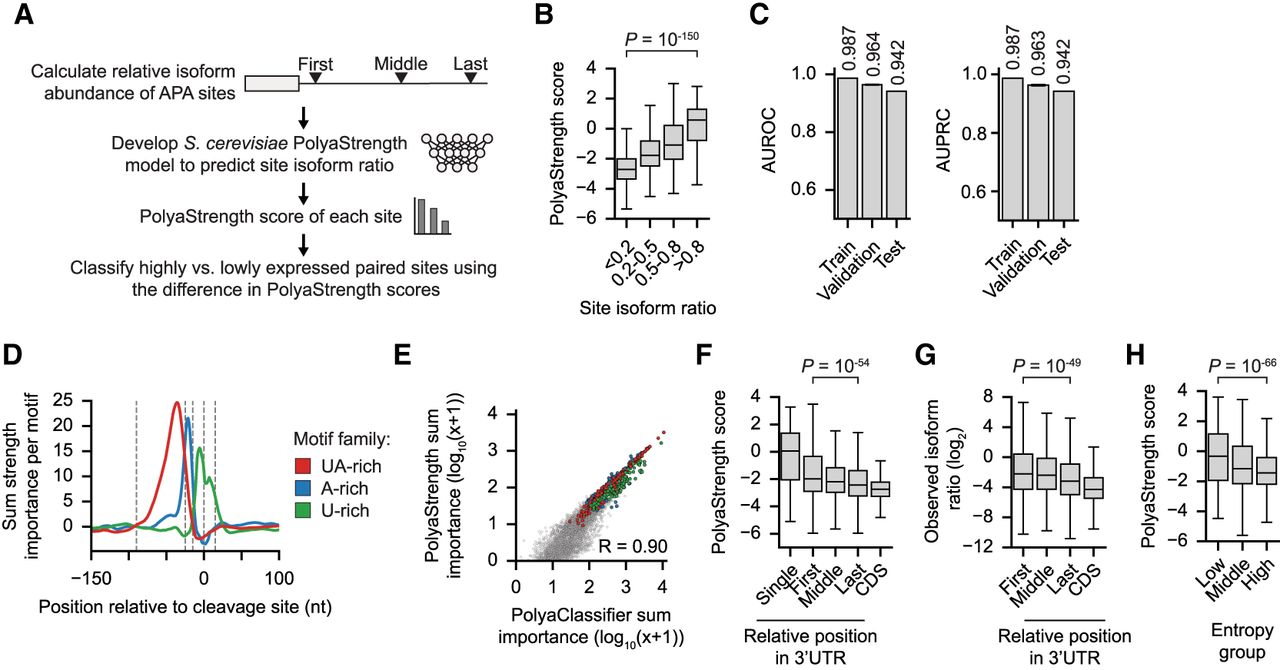
Development of the S. cerevisiae PolyaStrength model. (A) Diagram depicting how the S. cerevisiae PolyaStrength model was trained on the relative isoform abundance for APA sites in the 3′ UTR. (B) Box plot showing the predicted PolyaStrength scores grouped by observed site isoform abundance (N = 2392 sites with usage <0.2, 798 with usage 0.2–0.5, 584 with usage 0.5–0.8, and 375 with usage >0.8). (C) The AUROC and AUPRC values showing the performance of the S. cerevisiae PolyaStrength model to distinguish lowly versus highly used 3′-UTR-APA sites (more than eightfold) from the training, validation, and testing sets. The mean and standard deviation (error bar) from 10 sets of sampled poly(A) site pairs are shown for each data split, with the mean noted above each bar. (D) The per-motif sum importance scores around the max cleavage sites for indicated cis-regulatory element families. Significant motifs with a Hamming distance ≤2 nt from the archetypical motifs UAUAUA/AUAUAU, AAAAAA, and UUUUUU were included. (E) Scatter plot showing the correlation between the motif importance scores for the S. cerevisiae PolyaClassifier and PolyaStrength models. The peak sum importance score in any 20 nt window is used, and the Pearson's correlation is shown. The important poly(A) motifs are colored. (F) The predicted PolyaStrength scores for poly(A) site types based on their relative position. The P-value from the Wilcoxon rank-sum test comparing the first versus last 3′-UTR-APA sites is shown. (G) The observed isoform ratios of coding region and 3′-UTR-APA sites. For details about how the isoform ratio is calculated, see Methods. The P-value from the Wilcoxon rank-sum test comparing first versus last 3′-UTR-APA sites is shown. Single 3′-UTR sites are not included. (H) The predicted PolyaStrength scores for low, middle, and high entropy poly(A) sites from Figure 3. The P-value using the Wilcoxon rank-sum test comparing the low versus high entropy groups is shown.


