
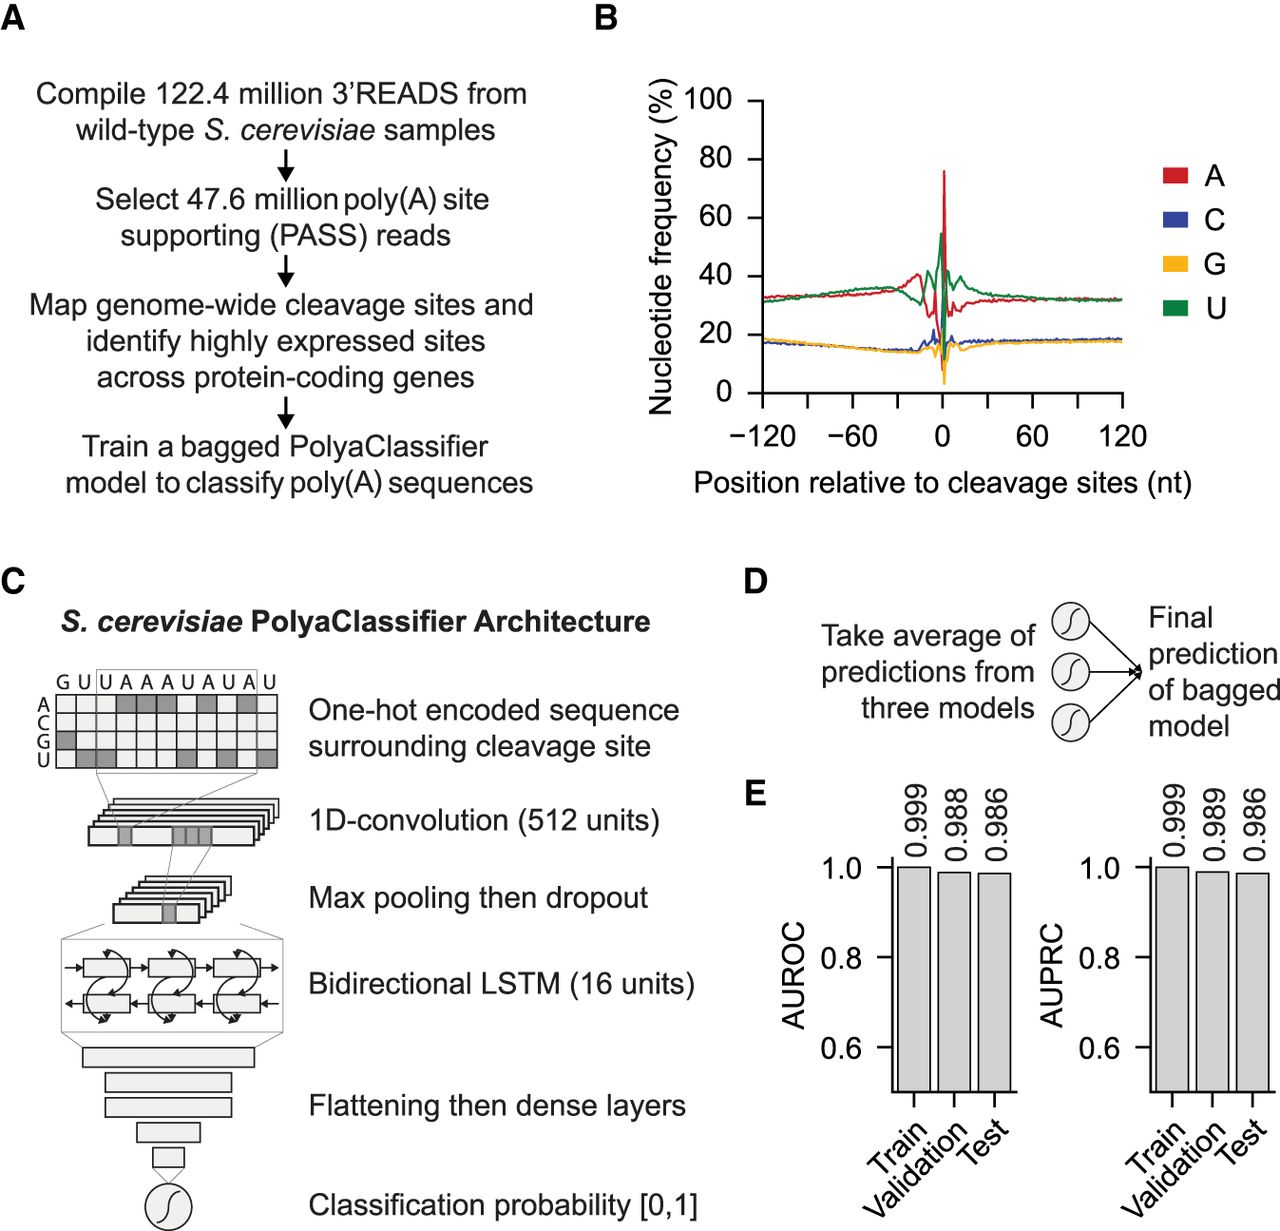
Developing the S. cerevisiae PolyaClassifier model. (A) Overview of 3′READS data processing and the model training steps. (B) Distribution of nucleotide frequency surrounding the cleavage sites in S. cerevisiae. (C) Architecture of the S. cerevisiae PolyaClassifier model, which is described in more detail in Supplemental Table S2. (D) Schematic illustrating how the final bagged S. cerevisiae PolyaClassifier model predictions are calculated from the average predictions from three individual models trained on resampled data. (E) The AUROC and AUPRC values showing the classification performance of the PolyaClassifier constituent models on the training, testing, and validation sets. The AUROC and AUPRC values are shown.


