
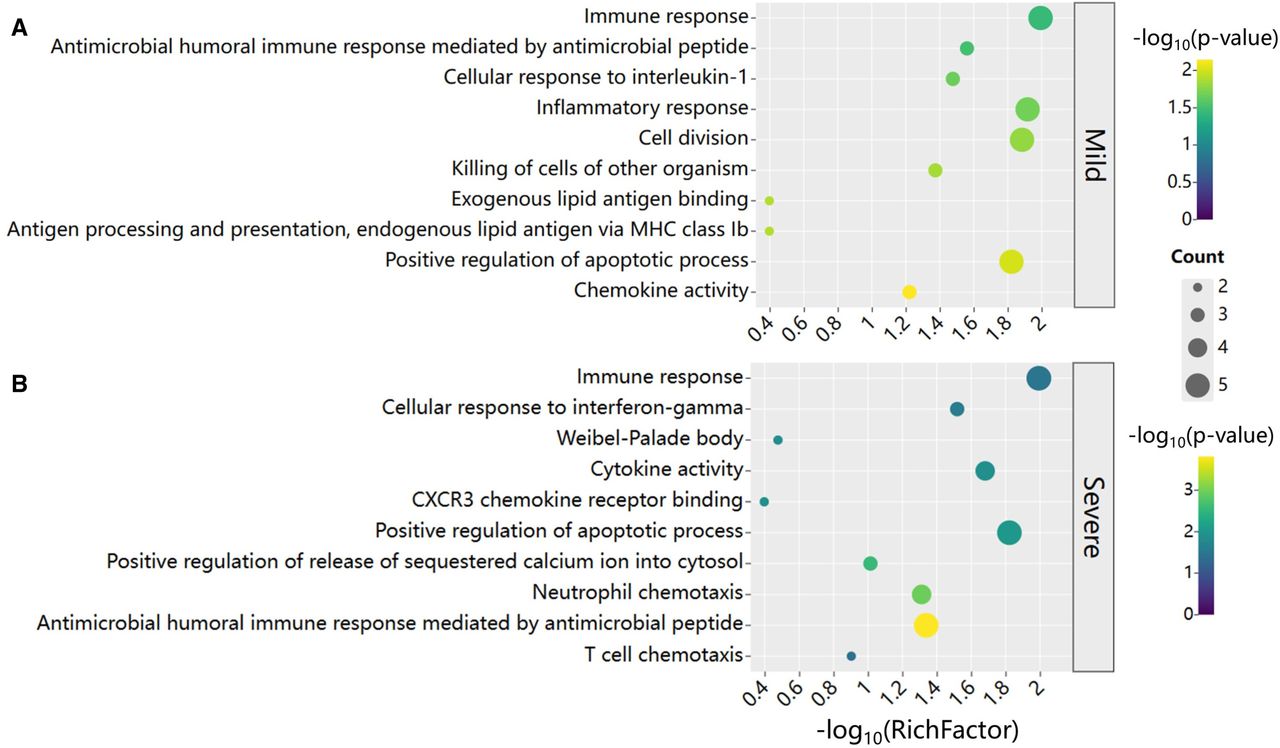
Figure 6.
GO enrichment analysis for COVID-19 by scHGR. Based on the top 50 genes selected by scHGR, GO enrichment is performed separately in mild (A) and severe (B) patients. Rows represent GO terms, and columns represent −log10(RichFactor), where RichFactor = n/N, n is the number of genes belonging to GO term in gene list, and N is the number of genes belonging to GO term in genome. The color of bubbles represents the significance of GO term, and the size represents the number of genes enriched in GO item.


