
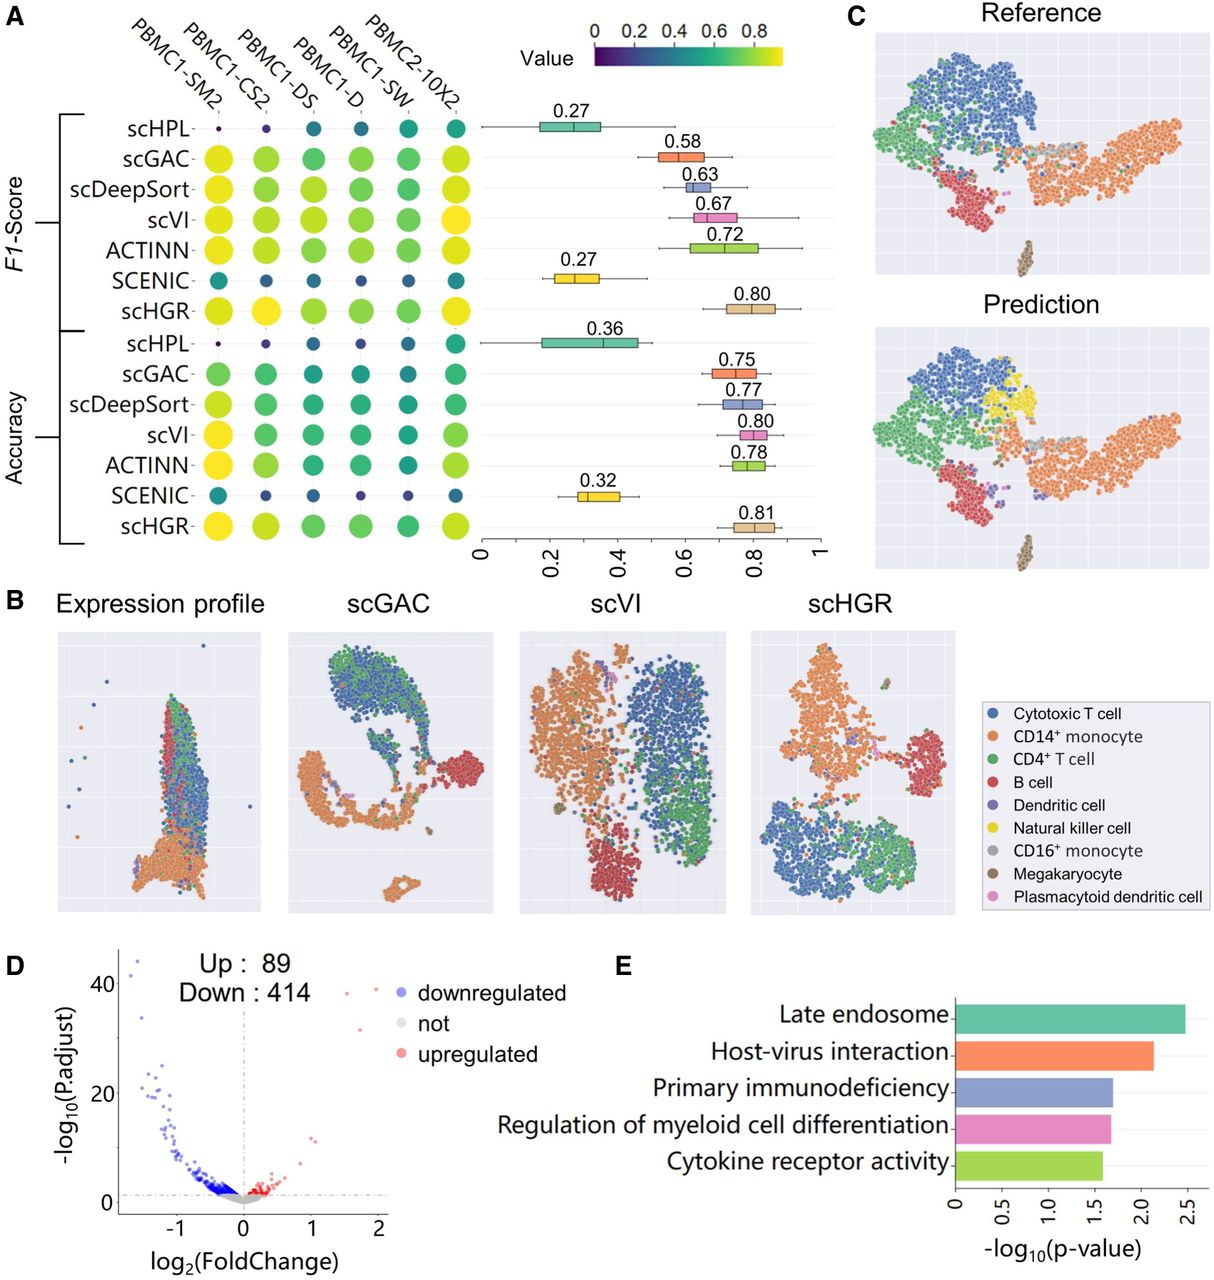
Performance evaluation of different tools across sequencing technologies and novel subtype revealing by scHGR. (A) Heatmap of the F1-score and accuracy resulting from cross-technology experiments, where rows represent methods and columns represent data sets. Box plots summarize the maximal, minimal, median, and quantile accuracy, as well as F1-scores for different methods. The median value is labeled above the corresponding box. (B) Colored according to reference data set labels, t-SNE plots the raw expression profiles of PBMC1-SW and cell embeddings generated from scGAC, scVI, and scHGR. scHPL and scDeepSort are not contained because cell embeddings are not available from their output. (C) t-SNE visualizes cell embeddings in PBMC1-D derived from scHGR. (Top) The figure is colored referring to the cell type provided by reference data sets. (Bottom) The figure is colored referring to the cell type predicted by scHGR. (D) Volcano plots of DEGs detected from the expression profiles in Nature killer cells. The number of upregulated and downregulated genes is marked on the graph. (E) The GO enrichment result of DEGs.


