
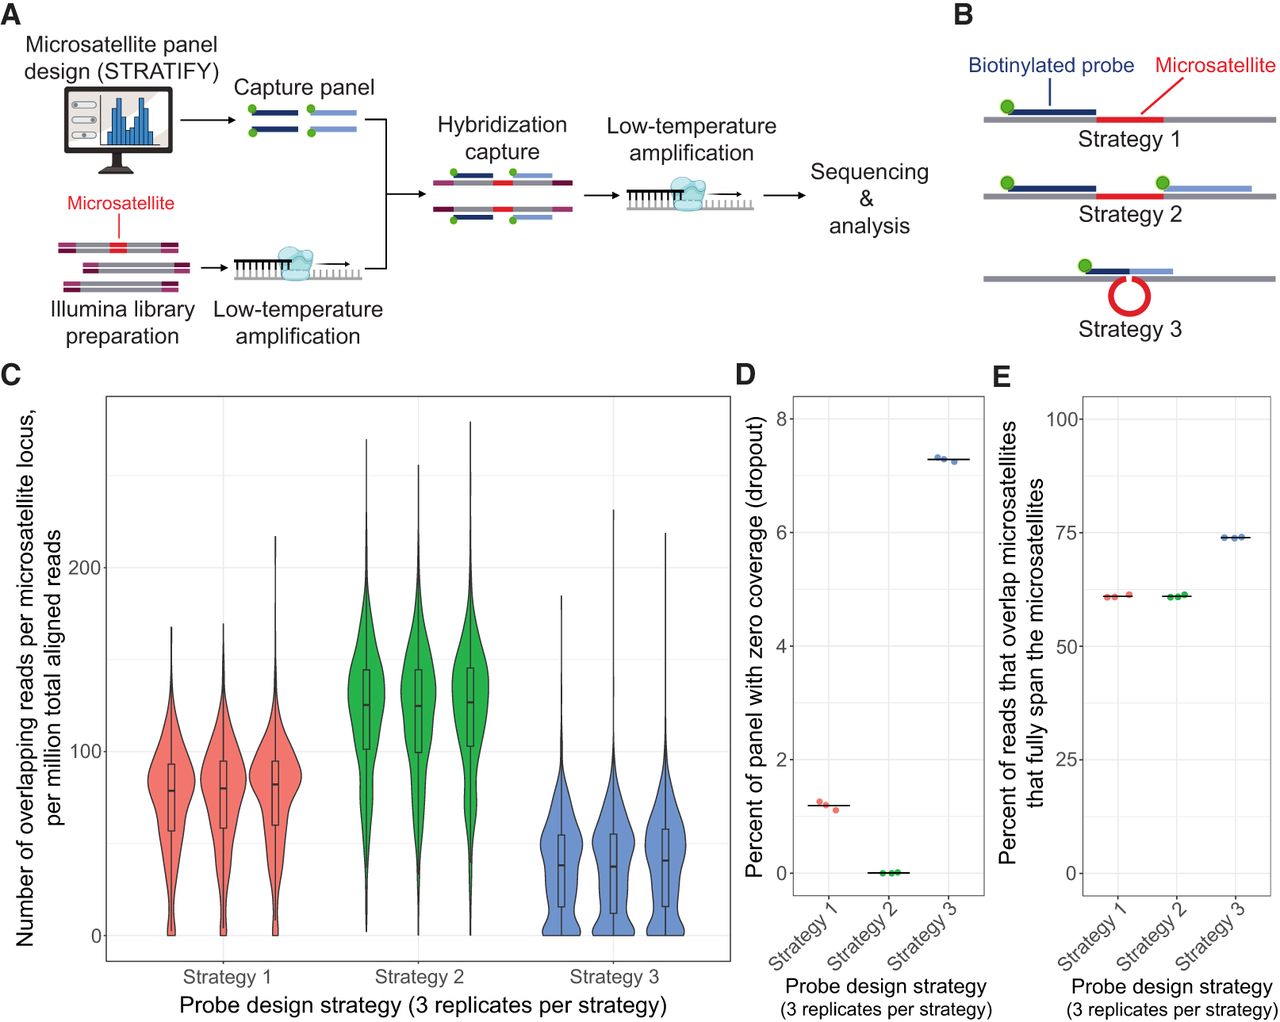
Overview of method and probe design strategy. (A) Schematic of microsatellite panel design, library preparation, hybridization capture, sequencing, and analysis. (B) The three probe design strategies tested in the pilot capture panel. (C) Distribution of coverage across targeted microsatellite loci for each probe design strategy. Normalized coverage is plotted as the [number of microsatellite-spanning reads at the locus]/[number of million aligned reads in the sample]. Box-and-whiskers show the first quartile, median, and third quartile of the distributions. Whiskers show 1.5× the interquartile range. (D) Fraction of loci in the panel with zero coverage (i.e., “dropout”) for each probe design strategy. Mean value is represented by a black line. (E) Percentage of reads that overlap microsatellites that also fully span the microsatellites, for each probe design strategy. Calculated as [total number of reads fully spanning the targeted microsatellites]/[total number of reads overlapping targeted microsatellites by at least 1 bp] × 100. Mean value is represented by a black line. Note that C–E show experimental samples profiled using standard library amplification temperature.


