
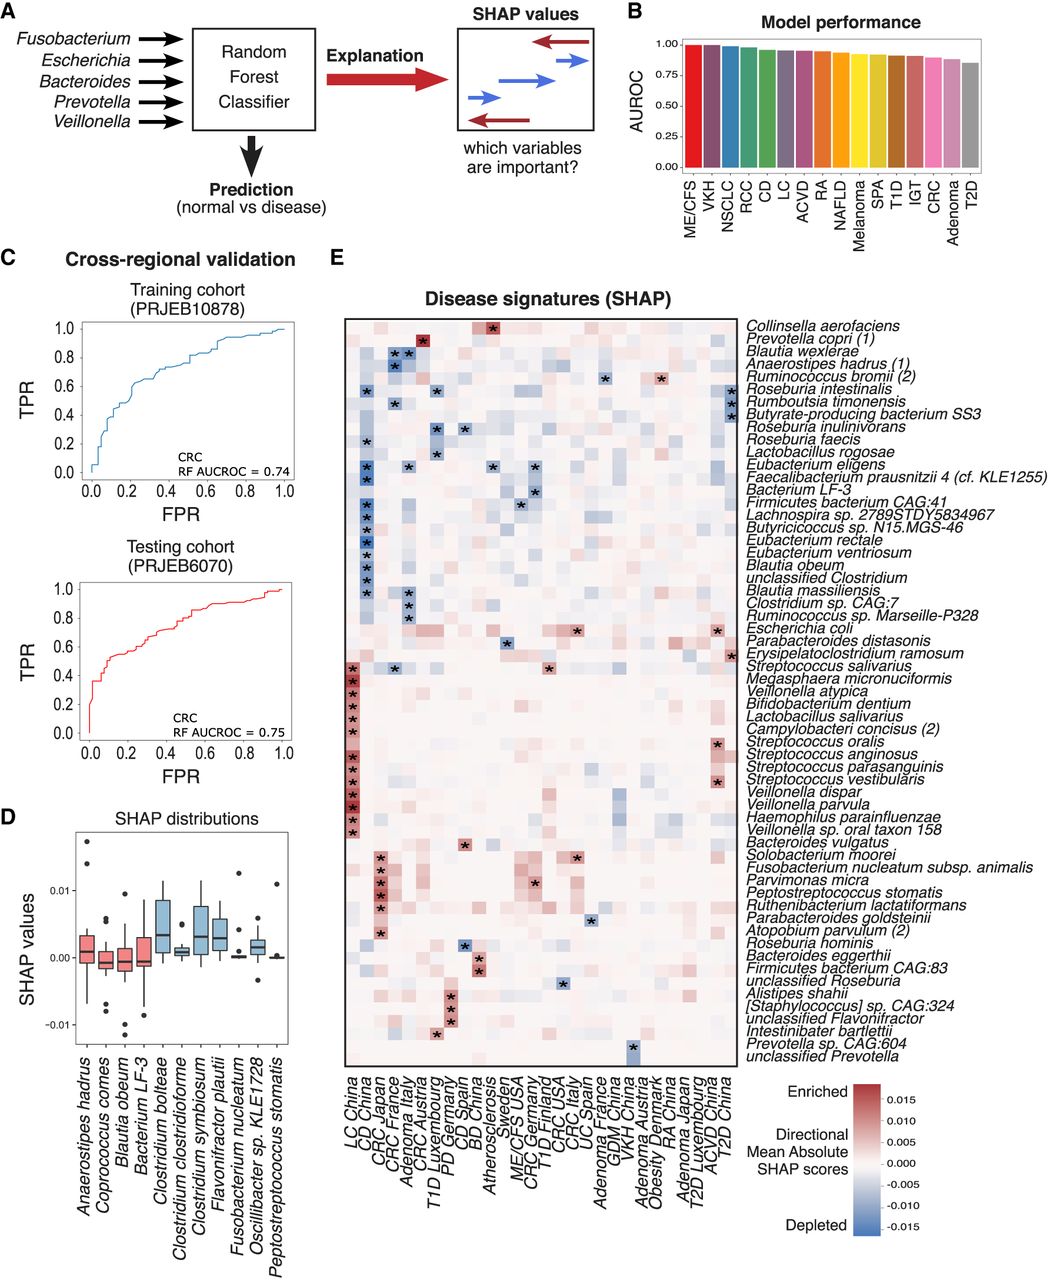
Random forest (RF) models trained on multiple cohorts to discriminate between disease and healthy controls. (A) Schematic of RF classification method. (B) AUROC scores for each disease RF classification model. (C) AUROC curves of an inter (top) and intra (bottom) cohort validation for a RF model that predicts CRC. (D) Box plot of directional mean absolute SHAP scores for all disease predictive models. Red and blue boxes represent species that were depleted/enriched using effect size calculation. (E) Clustered heatmap (dendrogram omitted) of the most important species for prediction of 16 diseases by RF classification as calculated by directional mean SHAP score (rows contain at least one species with directional mean SHAP score above 0.0125 in any of the diseases; Methods). Positive values indicate that higher relative abundance is more likely to classify the disease versus healthy samples. Negative values indicate that lower relative abundance is more likely to classify the disease versus healthy samples. The right color bar indicates mean species bias for enrichment or depletion in all diseases. Acronyms are as follows: (CRC) colorectal cancer, (NSCLC) non-small-cell lung cancer, (RCC) renal cell carcinoma, (T1D) type 1 diabetes, (T2D) type 2 diabetes, (LC) liver cirrhosis, (NAFLD) nonalcoholic fatty acid liver, (CD) Crohn's disease, (RA) rheumatoid arthritis, (SPA) ankylosing spondylitis, (ME_CFS) myalgic encephalomyelitis/chronic fatigue syndrome, (IGT) impaired glucose tolerance, and (VKH) Vogt–Koyanagi–Harada.


