
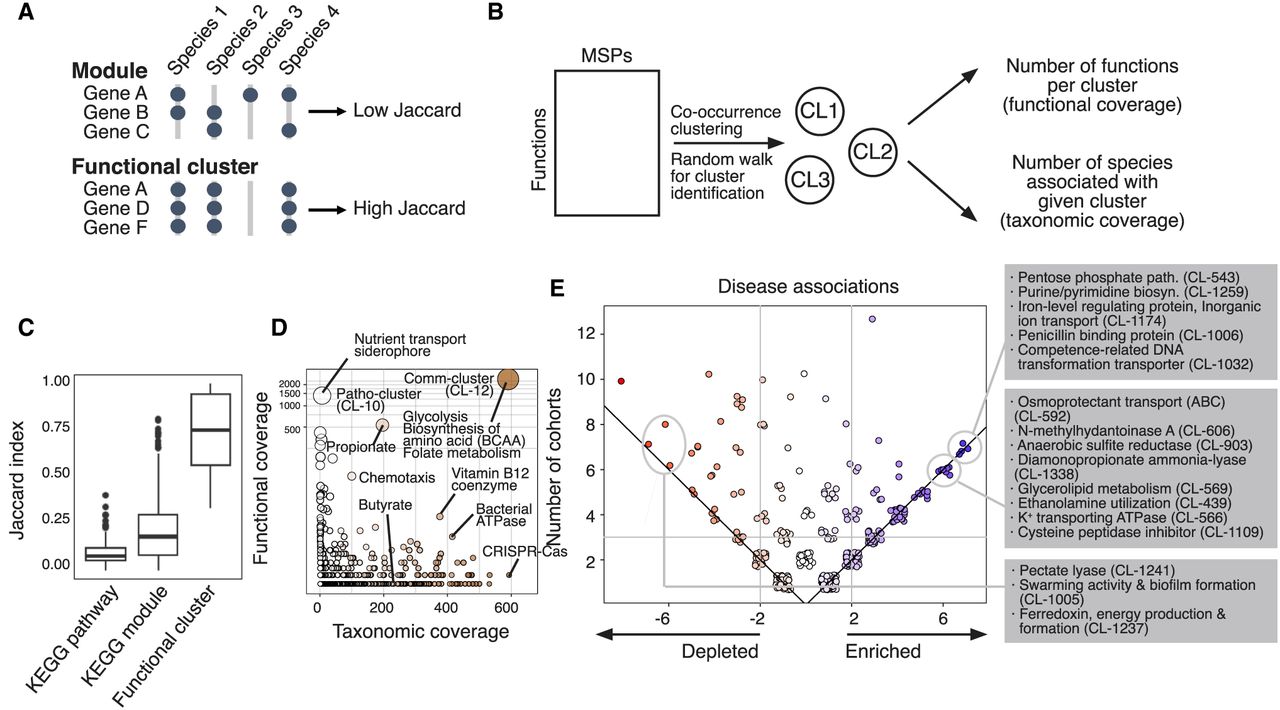
Analysis of functional clusters of the human gut microbiome. For the functional characterization of human gut MSPs, we annotated respective genes with 19,540 features of microbial function/phenotype databases and identified 7763 functional clusters better representing the microbiome. (A) Identification of functional clusters based on co-conserved molecular and biological functions across species. Unlike the manually curated module database, we identified functional clusters based on high co-conservation across species using the unsupervised clustering method. (B) The overall scheme of identification of functional clusters and checking functional coverage (cluster size) and taxonomic coverage (number of enriched species). (C) We found that among different sources of microbial functional annotations (e.g., KEGG module and pathway), co-conservation of molecular and biological functions across different species was substantially low (Jaccard index < 0.5). (D) Functional clusters identified by unsupervised community detection. The y-axis displays the number of genes within the functional cluster (i.e., functional coverage), and the x-axis displays the number of MSPs possessing >70% of the clusters’ genes (i.e., taxonomic coverage). (E) Functional clusters projected on enriched/depleted MSPs across disease cohorts. The scatter plot displays the frequency of functional clusters significantly associated with the enriched/depleted species (hypergeometric test P-value < 0.0001) in disease cohorts. Each point represents a gene cluster; all values in the plot are integers; and jitter was added to remove overlapping points. The y-axis shows the total frequency of cohorts in which a functional cluster was found significantly associated with enriched/depleted species. The x-axis shows the difference in the number of cohorts in which a function was found enriched minus the frequency it was found depleted. Point colors changed from red (left) to blue (right) according to x-axis values. Common enriched/depleted functional gene clusters among cohorts were identified when total frequency ≥ 3 and absolute subtracted frequency ≥ 2.


