
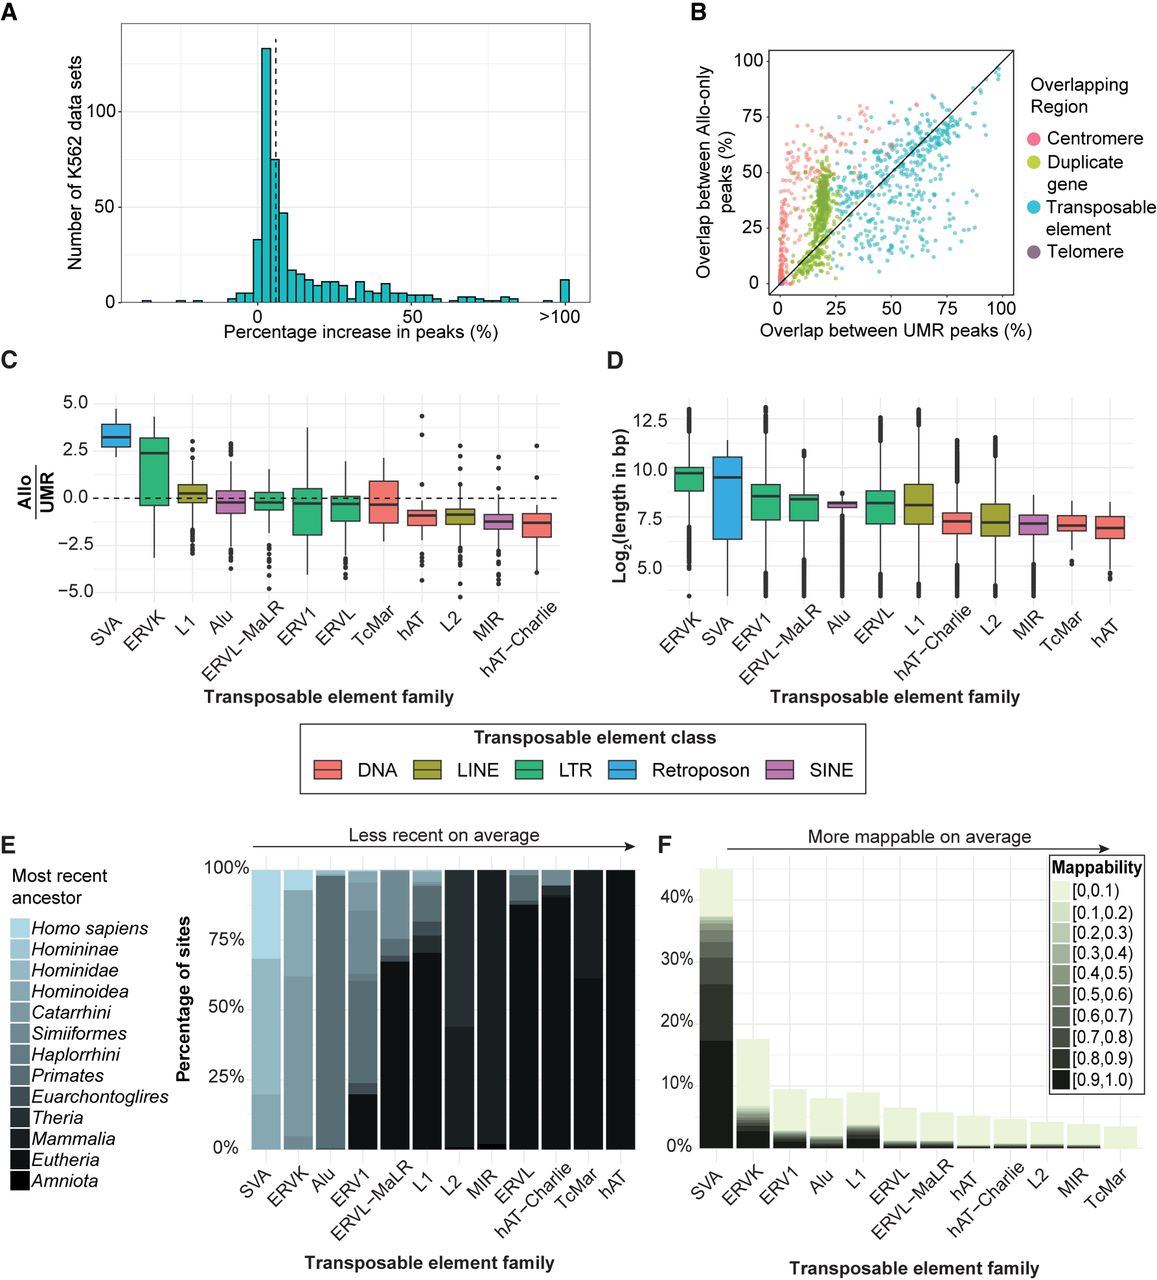
The use of Allo results in the discovery of additional peaks in 481 K562 data sets. (A) Percentage increase in peaks between the Allo-inclusive pipeline and the UMR-only pipeline across 481 ENCODE K562 ChIP-seq data sets. The dotted line represents the median increase in peaks (5.8%). (B) Percentage overlaps between Allo-only peaks and centromeres, telomeres, segmentally duplicated genes, and transposable elements (TEs). (C) The ratio between Allo-only peak overlap rates and UMR-derived peak overlap rates for each TE family. (D) Log2 read length of each TE insertion in hg38, grouped according to its respective repeat family. (E) Percentage of insertions within each TE subfamily that belong to each most recent ancestor. From left to right, the overall age increases. (F) Mappability score (UMAP K10069) of TE insertion sites, grouped according to their respective TE family. Mappability values equal to one (i.e., fully uniquely mappable) are not included.


