
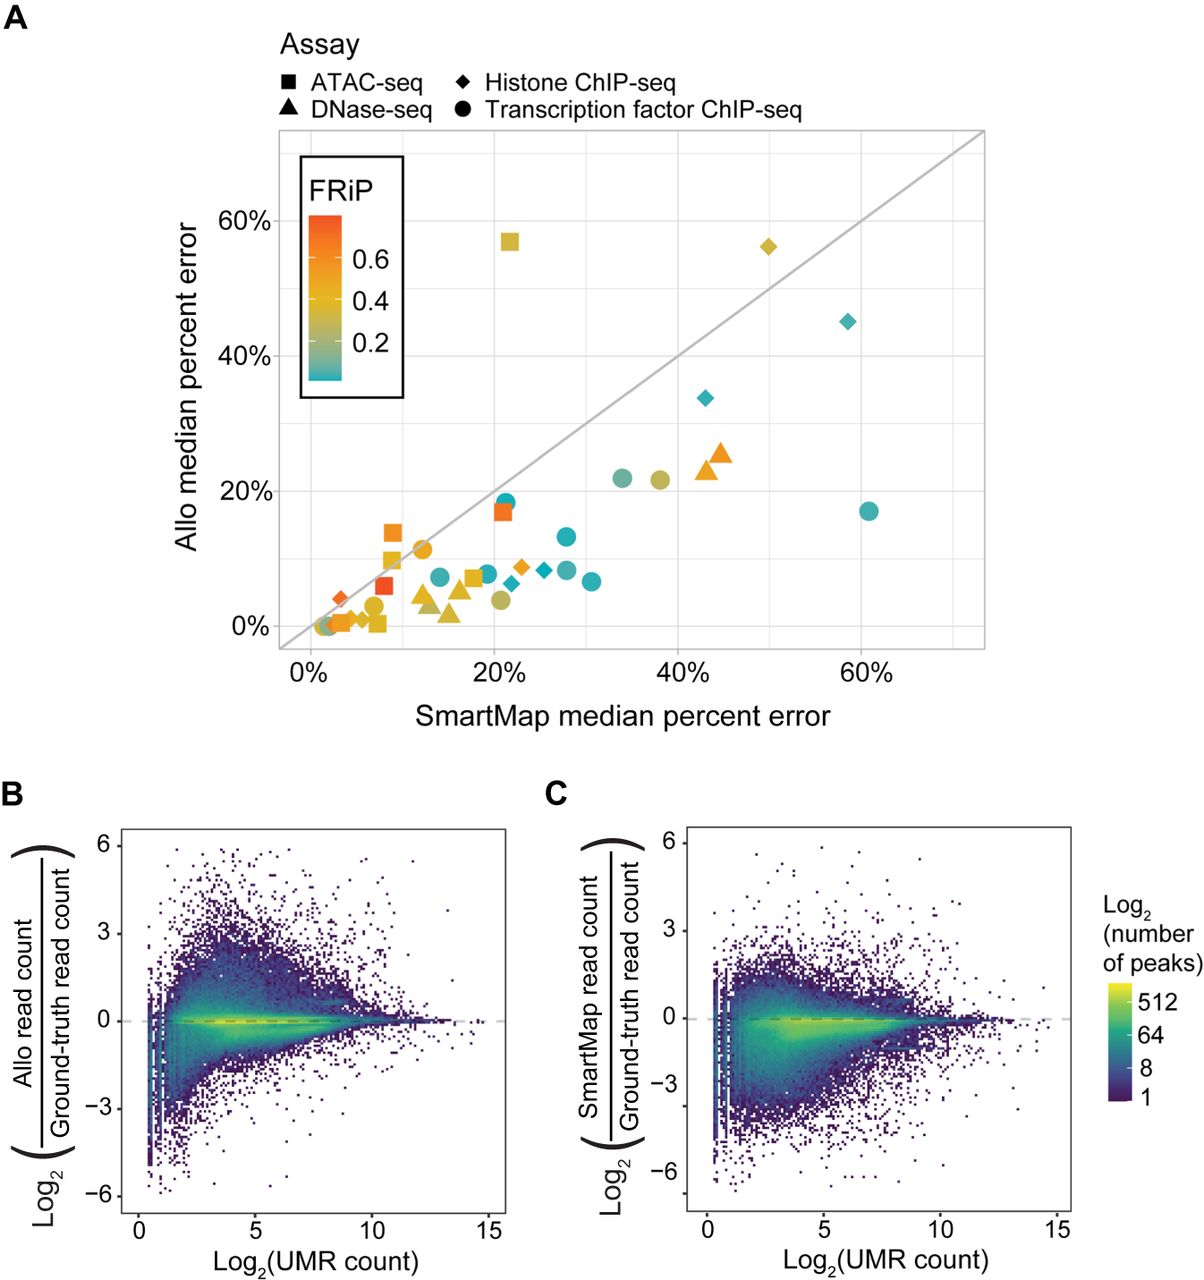
Figure 4.
Allo outcompetes SmartMap in overall MMR allocation. (A) Allo's median percentage allocation error versus SmartMap's median percentage allocation error across peaks in 38 testing data sets. The shape indicates data set assay, and the color indicates the FRiP score. (B) Log2 of Allo read counts divided by ground-truth read counts within peaks compared with the log2 of UMR counts in those regions. (C) Log2 of SmartMap read counts divided by ground-truth read counts within peaks compared with the log2 of UMR counts in those regions.


