
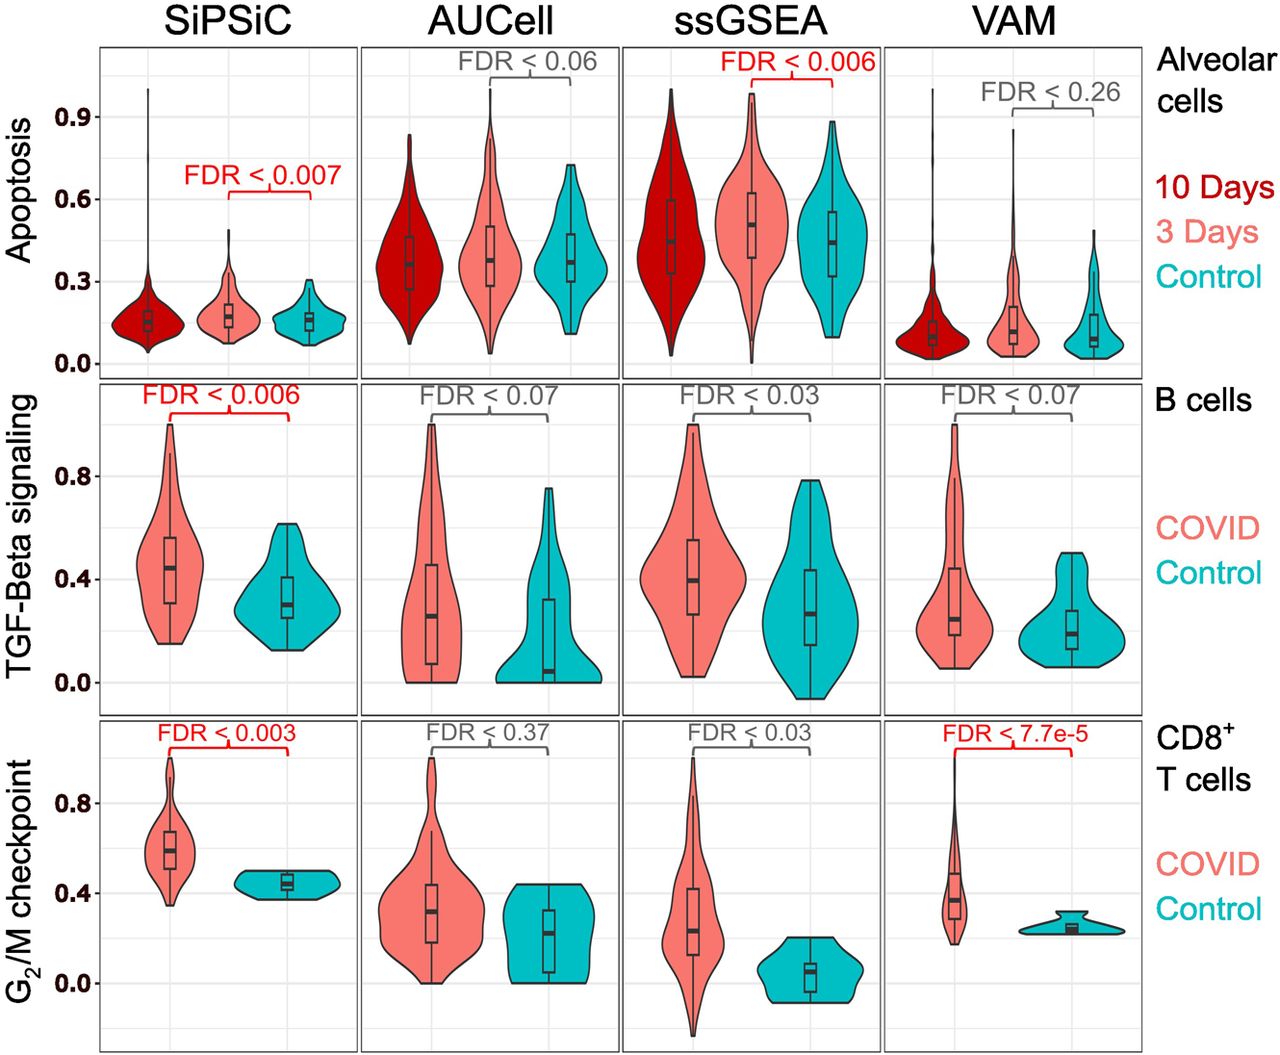
Figure 3.
SiPSiC shows improved accuracy compared with AUCell, ssGSEA, and VAM. Violin plots showing normalized pathway score distributions as calculated by the four different methods. Significant results (FDR < 0.01) are colored red. (Top) Apoptosis, monkey alveolar cells. (Middle) TGF beta signaling, human B cells. (Bottom) G2/M checkpoint, human CD8+ T cells.


