
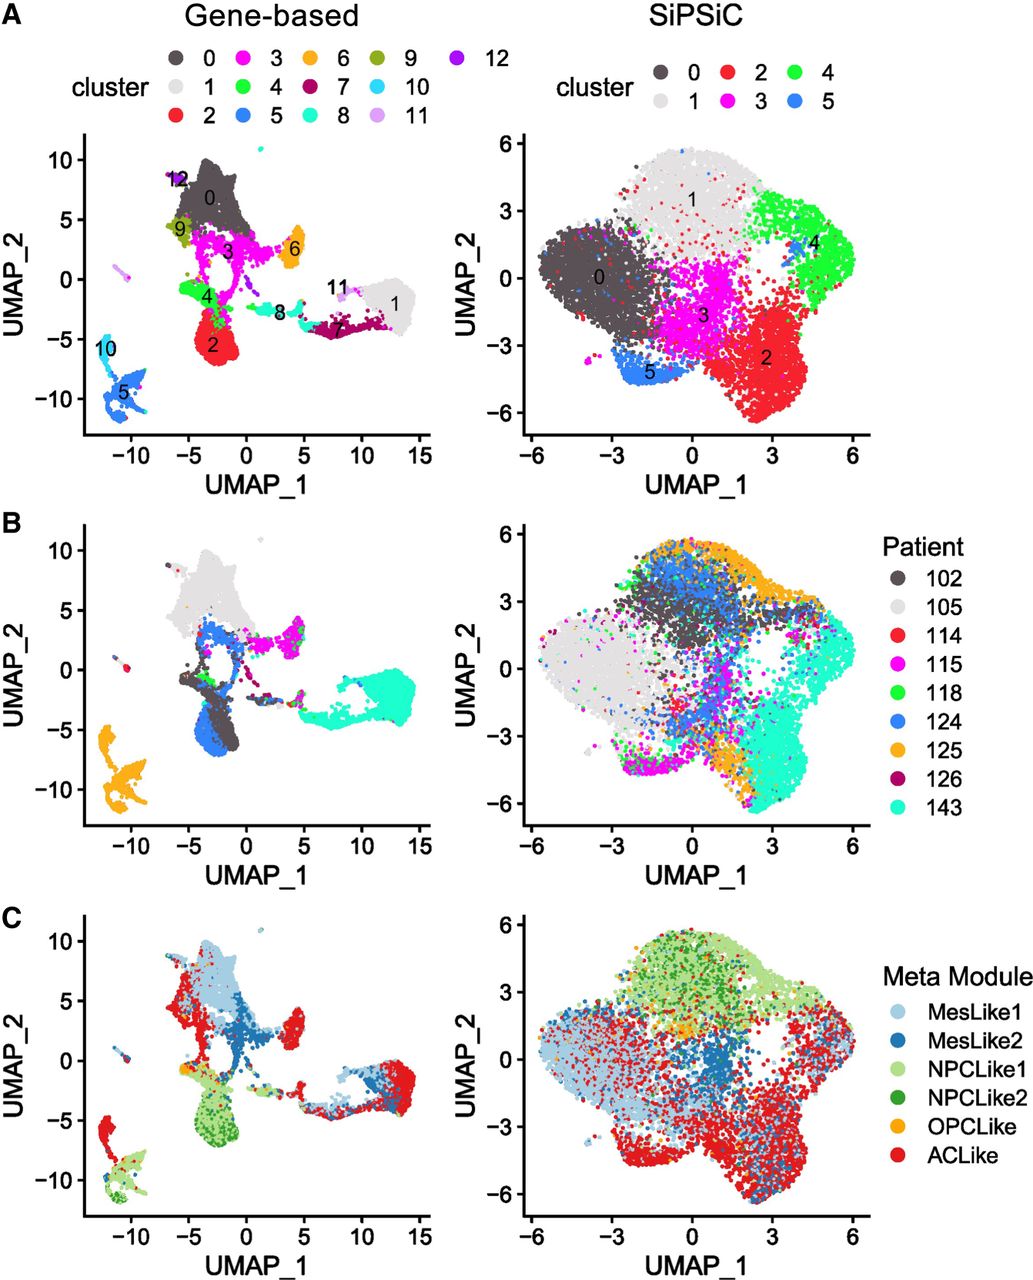
Figure 2.
SiPSiC-based clustering overcomes patient biases presented by gene-based clustering. (A–C) UMAP projections based on gene expression (left) and hallmark pathway scores by SiPSiC (right). (A) Cells were clustered by Louvain algorithm according either to SiPSiC scores or to gene expression. UMAPs show cells colored by cluster. (B) Cells colored by patient identity. (C) Cells colored by malignant metamodule assignment.


