
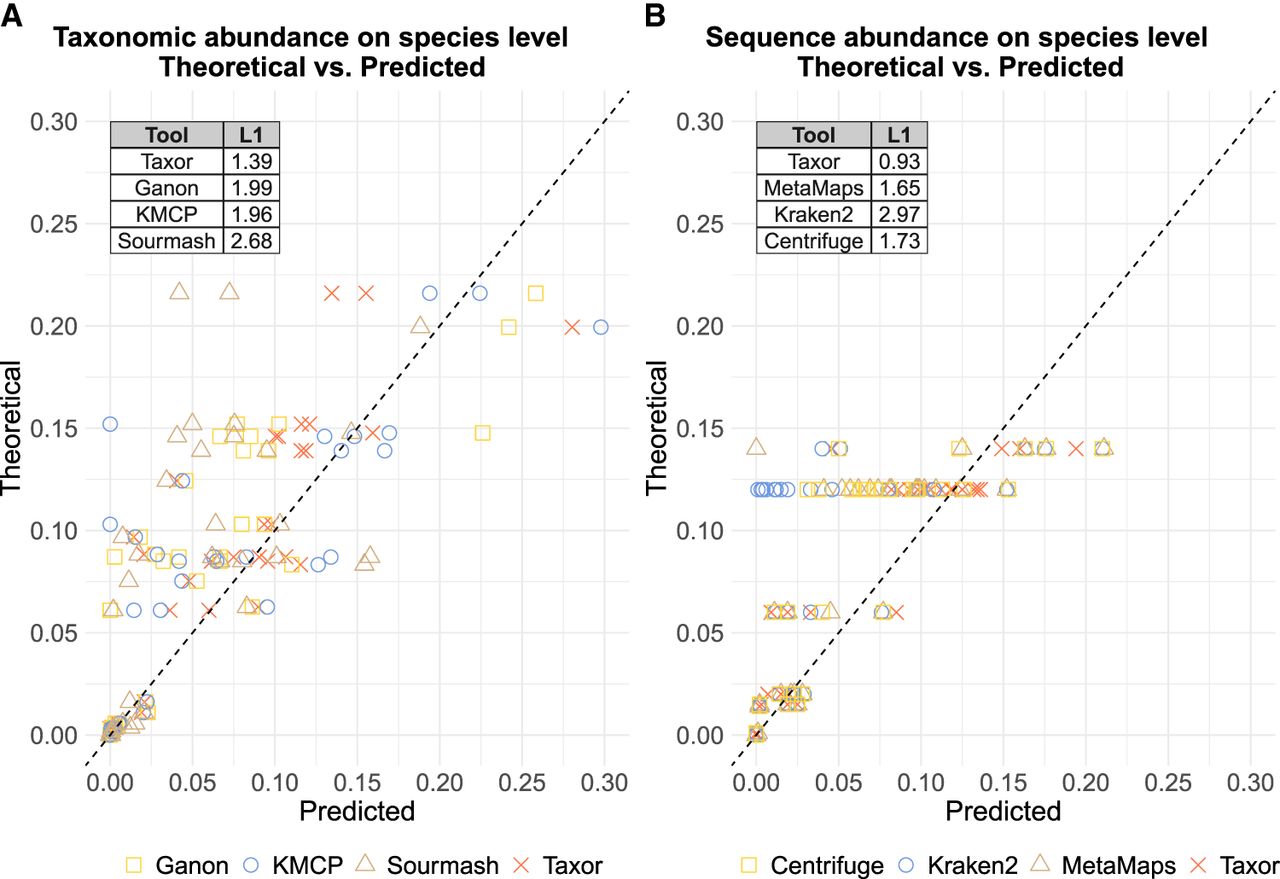
Figure 3.
Comparison of theoretical abundances and predicted abundances. For each species in the three long-read real mock communities, predicted abundances by the compared tools are plotted against the theoretical abundances. Points on the dashed line represent a perfect match between predicted and theoretical abundance. (A) Comparison of tools reporting taxonomic abundance. (B) Comparison of tools reporting sequence abundance. Taxor reports both abundance types and outperforms its competitors, having the smallest L1 distance between predicted and theoretical abundance.


